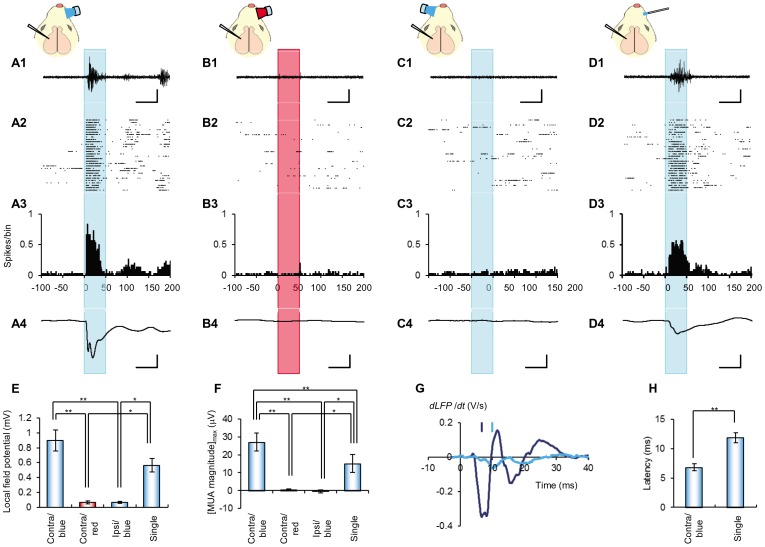
Figure 5. Barrel cortical activities evoked by whisker photostimulation.
A-D, Sample MUA recording traces (A1-D1), raster plots of spikes (A2-D2), peristimulus-time histograms (PSTHs, bin width = 1 ms) of spikes (A3-D3) and averaged LFP records (A4-D4) during blue irradiation to the contralateral whisker pad (A1-4), red irradiation to the contralateral whisker pad (B1-4), blue irradiation to the ipsilateral whisker pad (C1-4) or fiber-coupled irradiation of blue light to the D3 whisker follicle (D1-4). Scales, 50 ms and 100 μV (A1-D1) or 0.5 mV (A4-D4). E, Mean ± SEM of peak amplitudes of averaged LFP for each test; whisker pad irradiations (contralateral blue, contralateral red or ipsilateral blue, n = 7), single whisker irradiation (n = 5). F, Mean ± SEM of the maximum value of averaged MUA magnitude for each test. G, Sample differential of LFP (dLFP/dt) in response to the whisker pad irradiation (A4) and the single whisker irradiation (D4). Each bar indicates the time to reach the minimal dLFP/dt. H, Summary of LFP latency; whisker pad irradiation (n = 7) and single whisker irradiation (n = 5). The statistical significance was evaluated using paired t-test for E, F, and H; *, p<0.05 and **, p<0.005.

