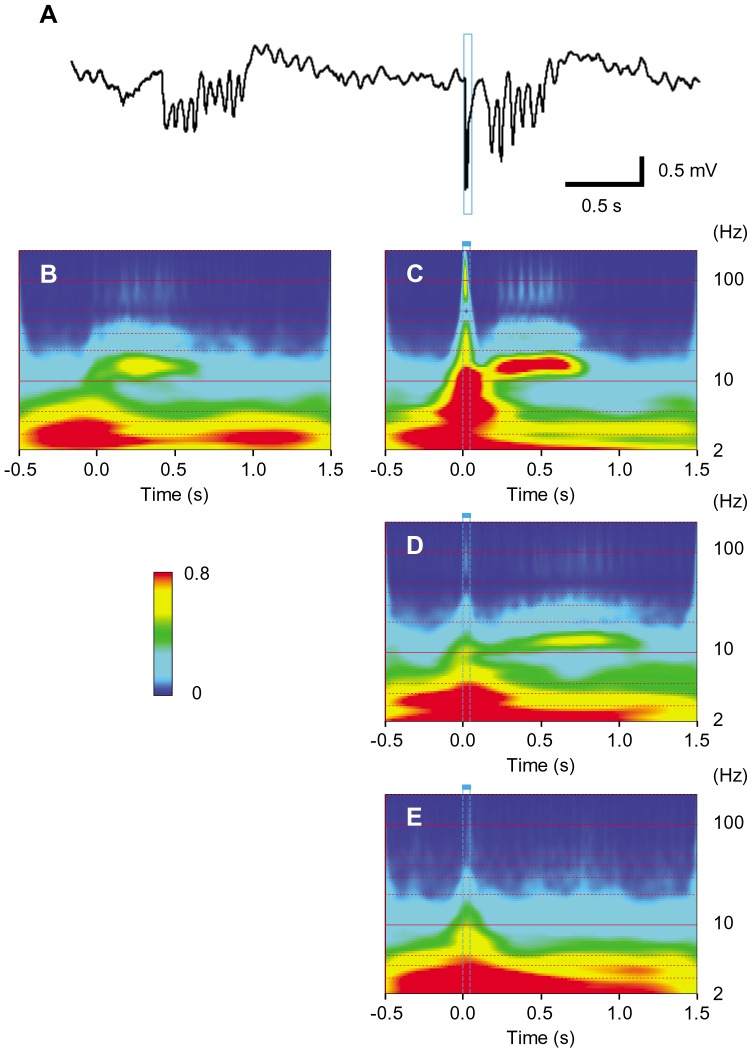
Figure 7. Cortical oscillations.
A, The spontaneous LFP oscillation (left) and the light-evoked oscillation (right). B, Wavelet analysis of spontaneous oscillation (n = 30). The timing of each oscillation was adjusted to the first peak. C-E, Wavelet analysis of the light-evoked responses; whisker pad irradiation (C, n = 30), single D3 whisker irradiation (D, n = 30) and single D6 whisker irradiation (E, n = 30).

