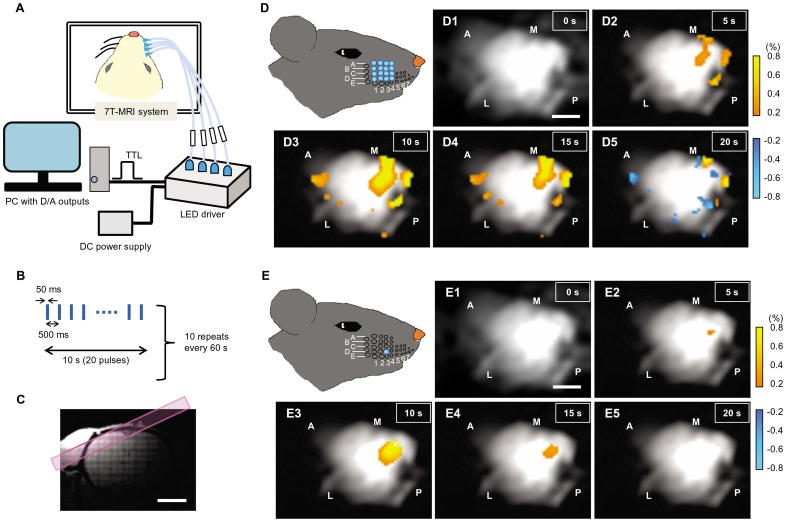
Figure 9. fMRI study of the optogenetic tactile sense (OTS).
A, System setup. B, The block design of the stimulation paradigm. C, Coronal T1 image of the rat brain. The region selected for getting the tangential images is shown by a magenta stripe. D, Sequential images indicating the change of BOLD signal (ΔBOLD) induced by 16-whisker photostimulation. The time from onset of the first light pulse is indicated; 0 s (D1), 5 s (D2), 10 s (D3), 15 s (D4) and 20 s (D5). E, Sequential images indicating theΔBOLD induced by a single D3 whisker photostimulation. The time from onset of the first light pulse is indicated; 0 s (E1), 5 s (E2), 10 s (E3), 15 s (E4) and 20 s (E5). Scale bars indicate 2 mm.

