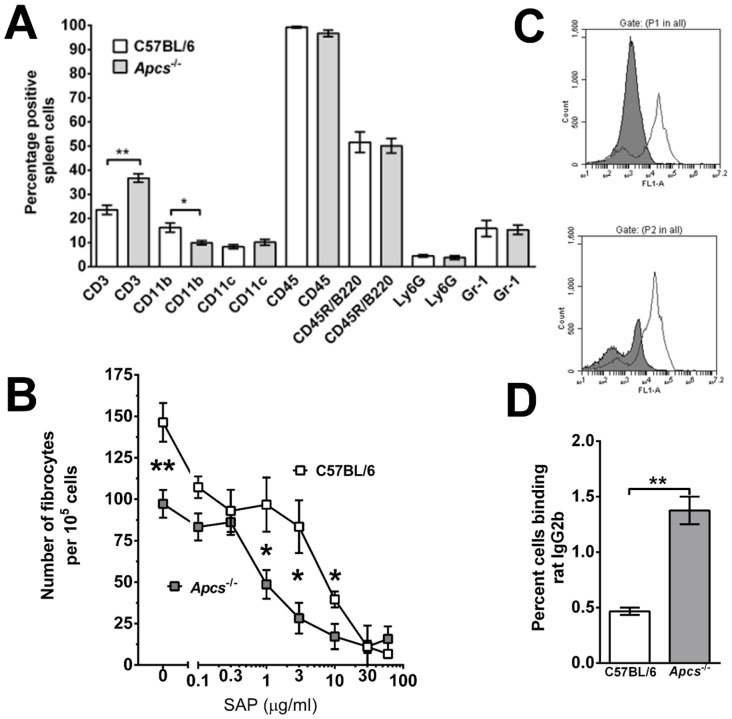
Figure 3. Spleen leukocyte populations and fibrocyte differentiation in Apcs-/- mice.
A) Spleen cells were analyzed for leukocyte cell populations using antibodies and flow cytometry. Values are mean ± SEM (n = 3 for C57BL/6; n = 4 for Apcs-/- mice). *p<0.05, **p<0.01 (t-test). B) Spleen cells were cultured for 5 days in the presence or absence of the indicated concentrations of SAP. After 5 days, cells were air-dried, fixed, and stained, and the number of fibrocytes was counted. Values are mean ± SEM (n = 3 for C57BL/6; n = 4 for Apcs-/- mice). *p<0.05 (t-test). C) Spleen cells from C57BL/6 (top panel) and Apcs-/- (bottom panel) mice were analyzed by flow cytometry for CD45R/B220 (white histogram) and CD16/32 (grey histogram) using a mAb (clone 93) to a common epitope of FcγRII and FcγRIII. Flow cytometry data is a representative of four independent experiments. D) Spleen cells were incubated with rat IgG2b antibodies and IgG2b binding was analyzed by flow cytometry. Values are mean ± SEM (n = 3 for C57BL/6; n = 4 for Apcs-/- mice). **p<0.01 (t-test).

