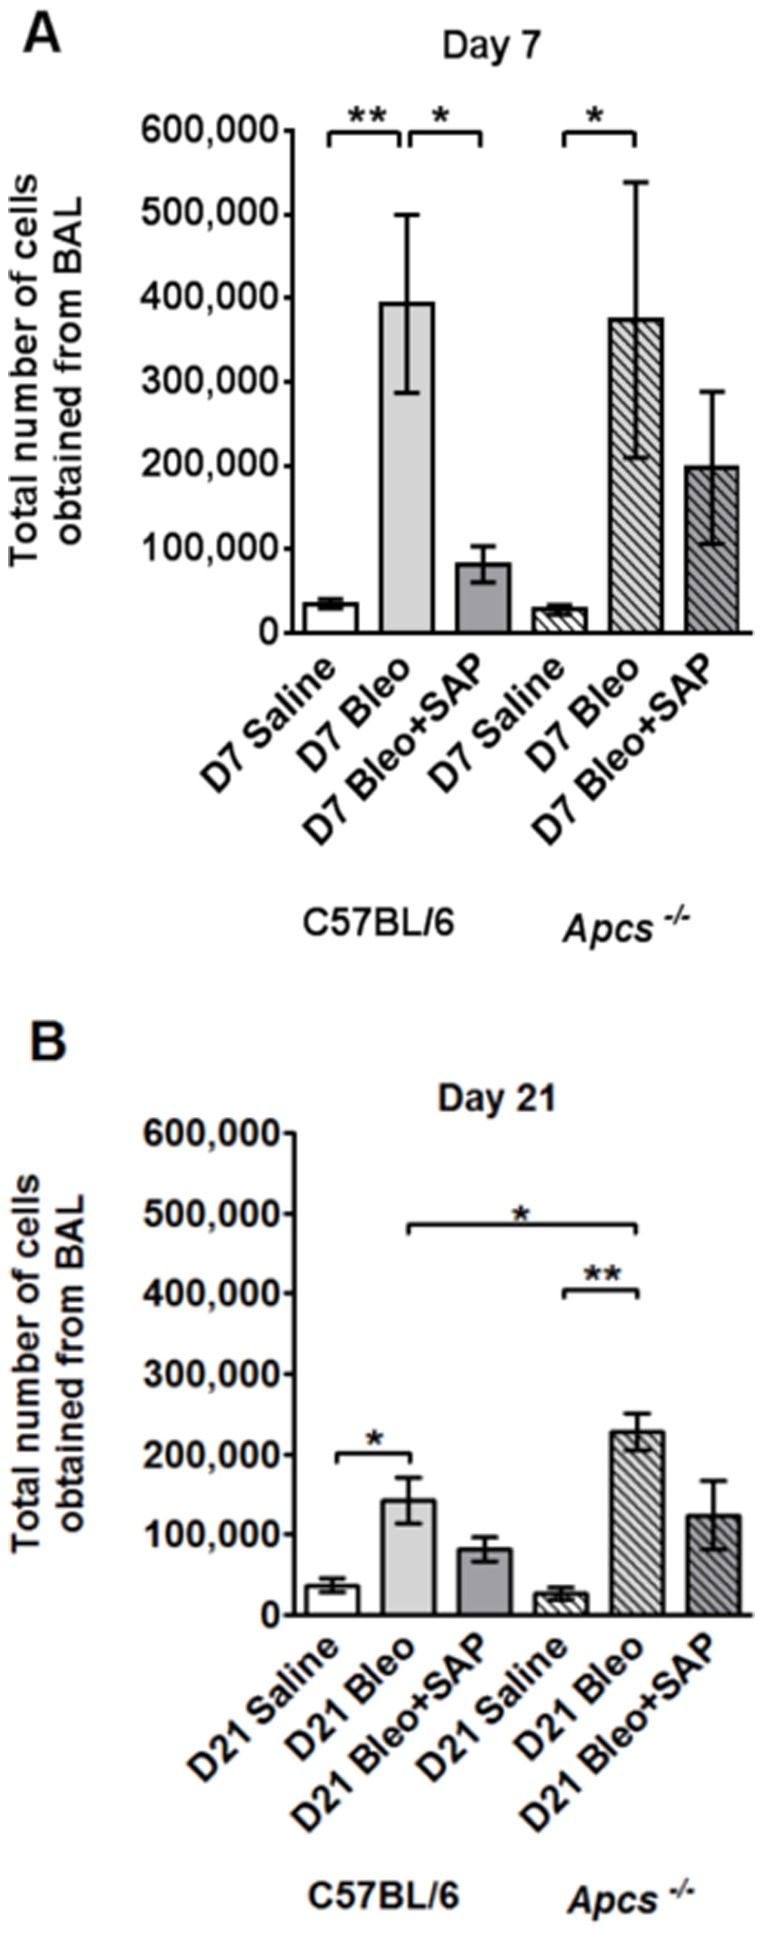
Figure 5. Changes in BAL cell number following bleomycin aspiration.

The total number of cells collected from the BAL is shown in A) for day 7 and B) for day 21. Values are mean ± SEM (n = 4–6 mice per group). *p<0.05, **p<0.01 (by ANOVA between groups, and t-test when comparing C57BL/6 and Apcs-/-).
