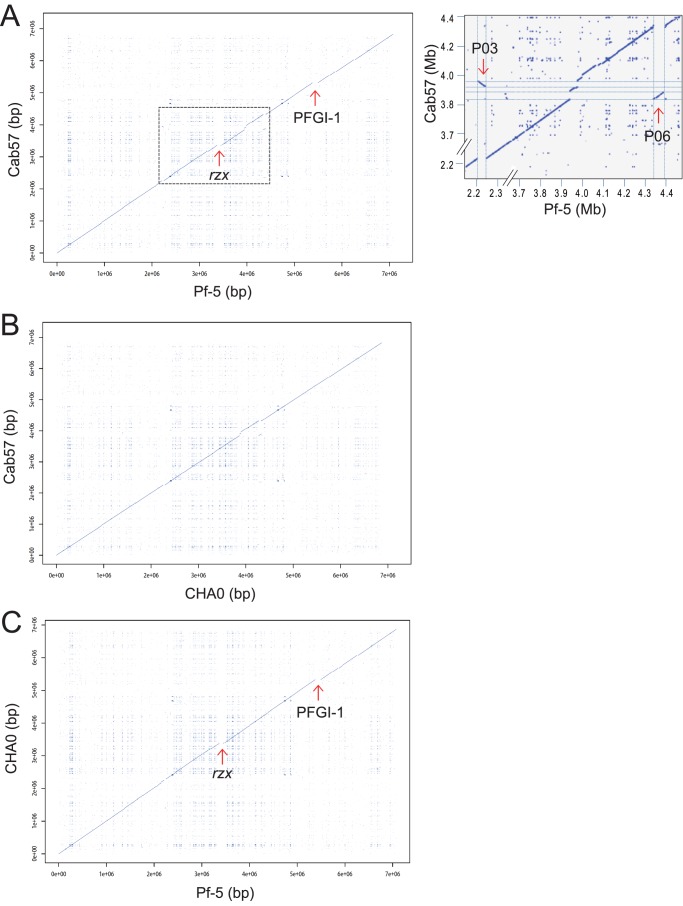
Figure 3. Syntenic dot plot of P. protegens strains.
Dot plot comparison of the Cab57 genome versus the Pf-5 genome (A), the Cab57 genome versus the CHA0 genome (B) and the CHA0 genome versus the Pf-5 genome (C). The blue line represents the regions of similarities between the two genomes while discontinuities in this syntenic line represent regions of genomic variations at a given locus between the two strains. Positions of phage-related elements and genomic island reported in the Pf-5 genome [34] are marked by arrows (P, Prophage; PFGI, Genomic island). The position of the biosynthetic gene cluster for rhizoxin analogs in the Pf-5 genome [17] is also indicated by an arrow (rzx). Regions corresponding to Pf-5 Prophage 03 (P03) and Prophage 06 (P06) in the Cab57 genome are surrounded by a dashed line in panel A and the expanded view is shown in the right.

