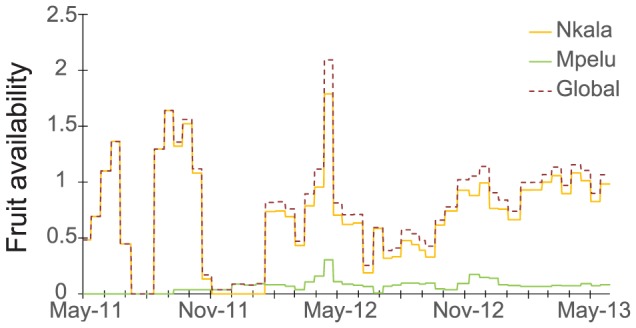
Figure 4. Global fleshy fruit availability and distribution per year.

This figure represents the daily fleshy fruit availability of the forest used for the cohesiveness model in the Nkala and Mpelu Forests (used in Model2), as well as the sum for both forests together (‘Global’, used in Model1).
