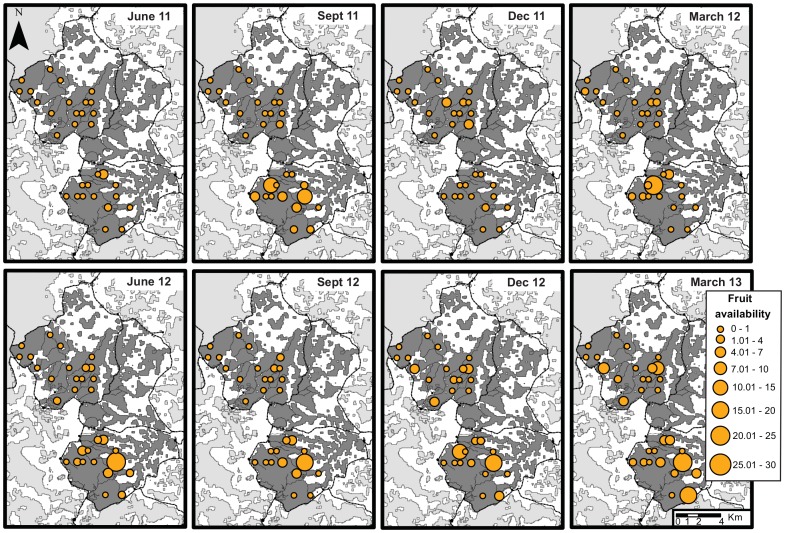
Figure 5. Maps of fleshy fruit availability and changes over time for each fruit tree plot.
The availability of fleshy fruit was calculated as the sum of the basal areas of the fruit-bearing observed in the plot, which was then divided by the plot area to reveal an index per hectare, similar to the fleshy fruit availability calculated for the nesting sites and the forest. Here we show a representation of the three-month mean. Circle sizes are proportional to the availability of fleshy fruits in the plots. Villages, roads and main forest paths are represented as in Figure 1.

