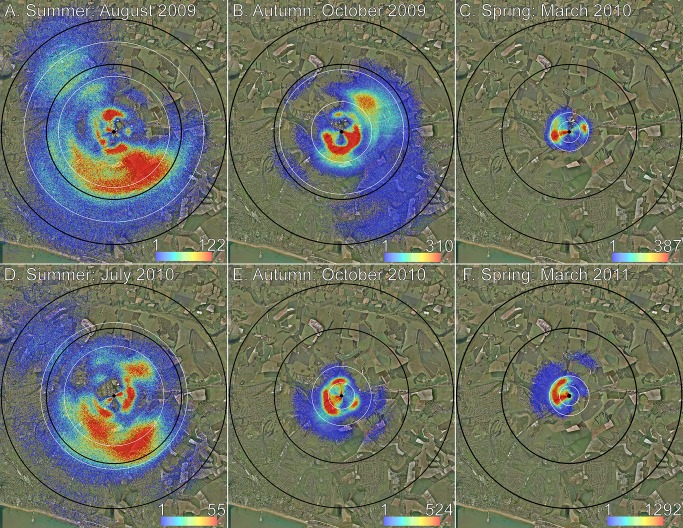
Figure 4. Distribution and density of foraging locations as determined by waggle dances.
Each dance is simulated 1000 times to incorporate the error inherent in dance information. Colour denotes how many dances fall within 25×25 m bins. Black circles are 3 and 5 km from the hive locations (centre black dot). White circles indicate the areas corresponding to the 90th and 50th foraging distance percentiles. Foraging range, containing a diversity of urban and rural land-types, extends the furthest (A, D) during summer (August 2009, n = 439×1000 dances; July 2010, n = 340×1000 dances), less far (B, E) in autumn (October 2009, n = 401×1000 dances; October 2010, n = 231×1000 dances), and least far (C, F) in early spring (March 2010, n = 114×1000 dances; March 2011, n = 195×1000 dances) when flowers are readily available.

