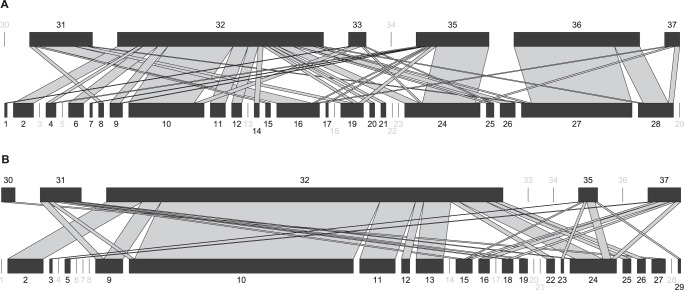
Figure 2. Bipartite food webs of predator-prey interactions on (A) bare soil, and (B) cover cropped banana plantation.
For each web, lower bars represent relative abundance of consumed prey, and upper bars represent relative abundance of positive ground-dwelling predators, each drawn at different scale. The width of links between ground-dwelling predators and prey represents the frequency of consumption. Numbers in grey indicate unlinked taxa. Visualization was performed with the R package “bipartite” [50]. 1: Anopheles claviger. 2: Anopheles nimbus. 3: Baetis rhodani. 4: Blatella germanica. 5: Calliphora vomitoria. 6: Carabidae spp. 7: Codophila varia. 8: Coridius chinensis. 9: Cosmopolites sordidus. 10: Diptera. 11: Drosophila anceps. 12: Drosophila melanica. 13: Drosophila montana. 14: Gryllus. 15: Hemiptera. 16: Jalysus spinosus. 17: Nebria chinensis. 18: Neoneides muticus. 19: Nezara viridula. 20: Oniscidae. 21: Ophyra spinigera. 22: Periplaneta americana. 23: Podisus serieventris. 24: Polytus mellerborgi. 25: Resseliella yagoi. 26: Sarcophila. 27: Scolopendra. 28: Scolopendra mutilans. 29: Stephensioniella sterrei. 30: Lycosidae. 31: Camponotus sexguttatus. 32: Euborellia caraibea. 33: Odontomachus baurii. 34: Scolopendridae. 35: Solenopsis geminata. 36: Staphilinidae. 37: Wasmannia auropunctata.

