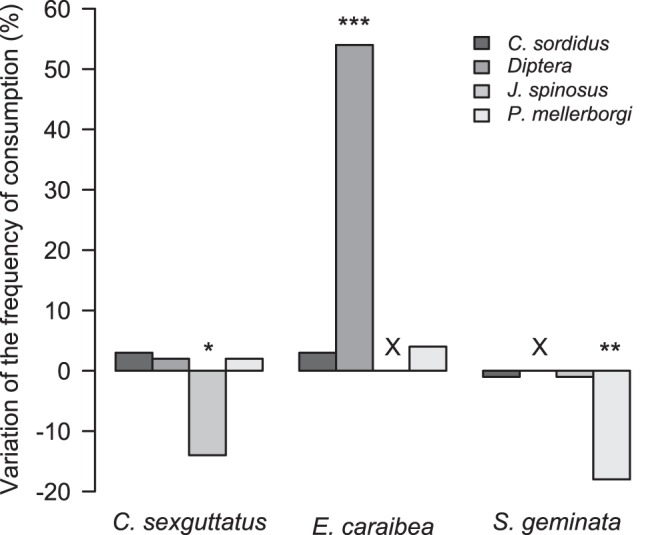
Figure 3. Diet changes of ground-dwelling predators between bare soil plot and cover cropped plot.

The bar charts display the difference of frequencies of consumption for each prey calculated between the two plots, with the bare soil plot as a reference. The significance of the difference of frequencies of consumption observed between plots was assessed with a Fisher’s exact test. (***: p-value<0.0001; **: p-value<0.001; *: p-value<0.01). Black crosses above bar charts indicate that the prey was not detected in both treatments.
