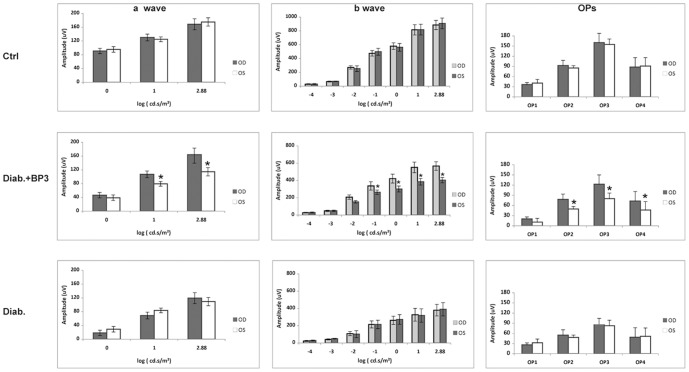
Figure 5. IGFPB-3 injection improves ERG amplitudes in treated eye.
Electroretinogram results for control, diabetic, and diabetic +IGFBP-3 treated animals. Left panels are A-wave, middle panels are B-wave and right panels show the oscillatory potentials. Data is shown for the right eye (OD) versus the left eye (OS). No changes are noted in the control or diabetic animals between ERG amplitudes. In the diabetic +IGFBP-3 treated group, the right eye (treated) has significantly higher A-wave and B-wave amplitudes that the untreated (OS) eye. N = 5 for all groups. Data are mean ± SD.

