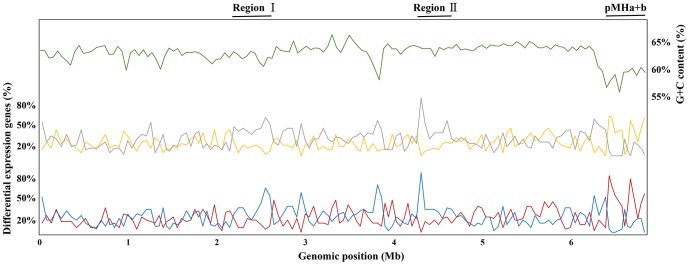
Figure 2. Visualization of global transcriptional profiles as determined by RNA-Seq and Microarrays.

The plot shows a summary of RNA-Seq and Microarrays expression data at all regions in bacteroids. Across the entire genome, the percentages of up-regulated genes of RNA-Seq and Microarrays are shown in yellow and red, while those of the down-regulated shown in gray and blue, respectively. The G+C content is in green. The percentage of differentially expressed genes and the GC content were computed with a sliding window of every 50 genes. Note the most prominent up-regulation in the symbiosis plasmids and the most prominent down-regulation in regions I and II in the chromosome.
