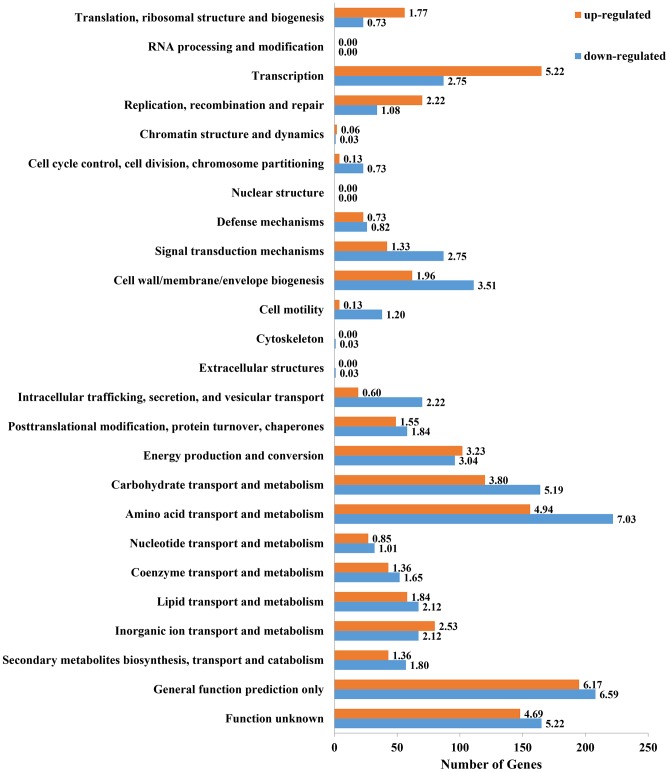
Figure 3. COG functional categories of differentially expressed genes identified by both RNA-Seq and Microarrays.
All differentially expressed genes during bacteroids were assigned to the 26 COG functional categories using RPS-BLAST (uncategorized genes not shown). Bars represent the number of up-regulated (orange) and down-regulated (blue) genes in bacteroids compared with free-living cells. The number in each bar represents its up/down-regulated percentage (%).

