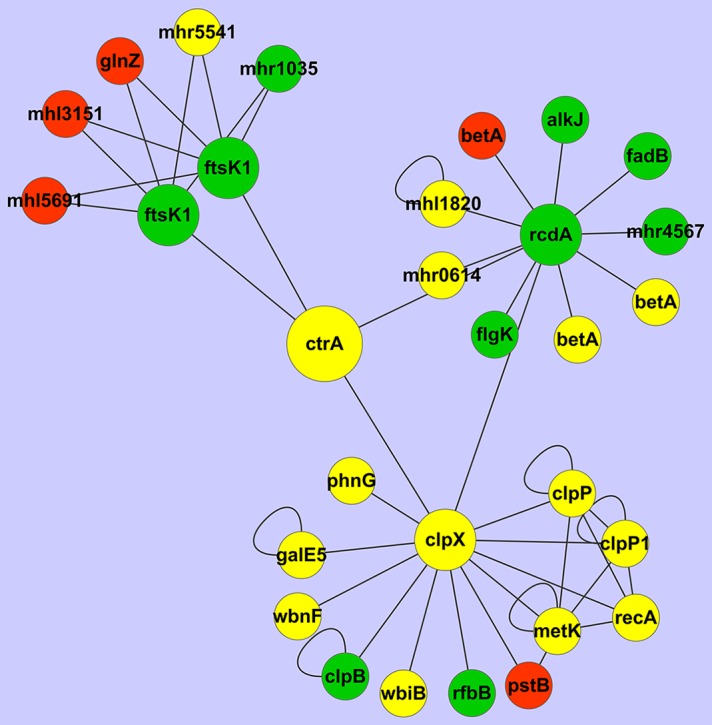
Figure 7. The subnetwork of CtrA and its interacting proteins in M. huakuii 7653R.

The genes up-regulated were shown in red, those down-regulated were shown in green and those of no change were shown in yellow.

The genes up-regulated were shown in red, those down-regulated were shown in green and those of no change were shown in yellow.