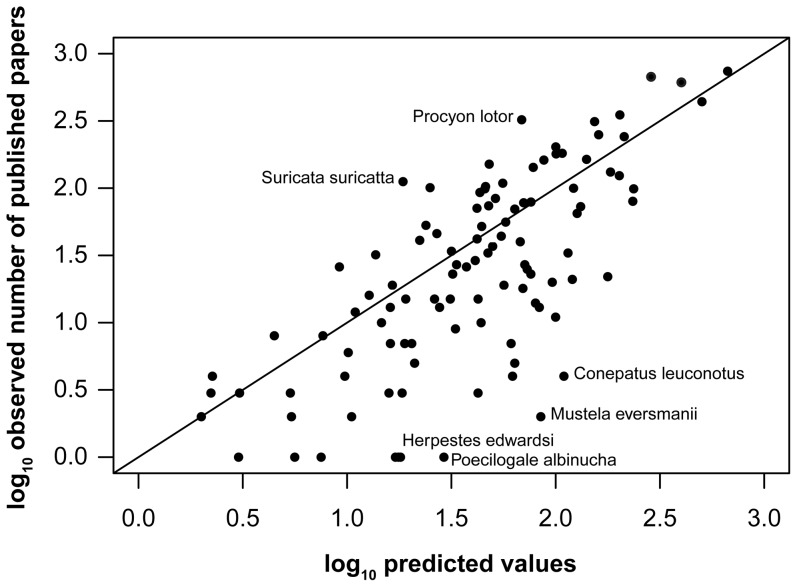
Figure 3. Analysis of model residuals: Predicted Vs Observed values.
The line indicates where the predicted values = observed values i.e. the model is a perfect fit to the data. Species which receive more research attention than our model predicts based on their biology are above the line whilst those receiving less are below the line. Species with residuals greater than +2 or −2 are labelled.

