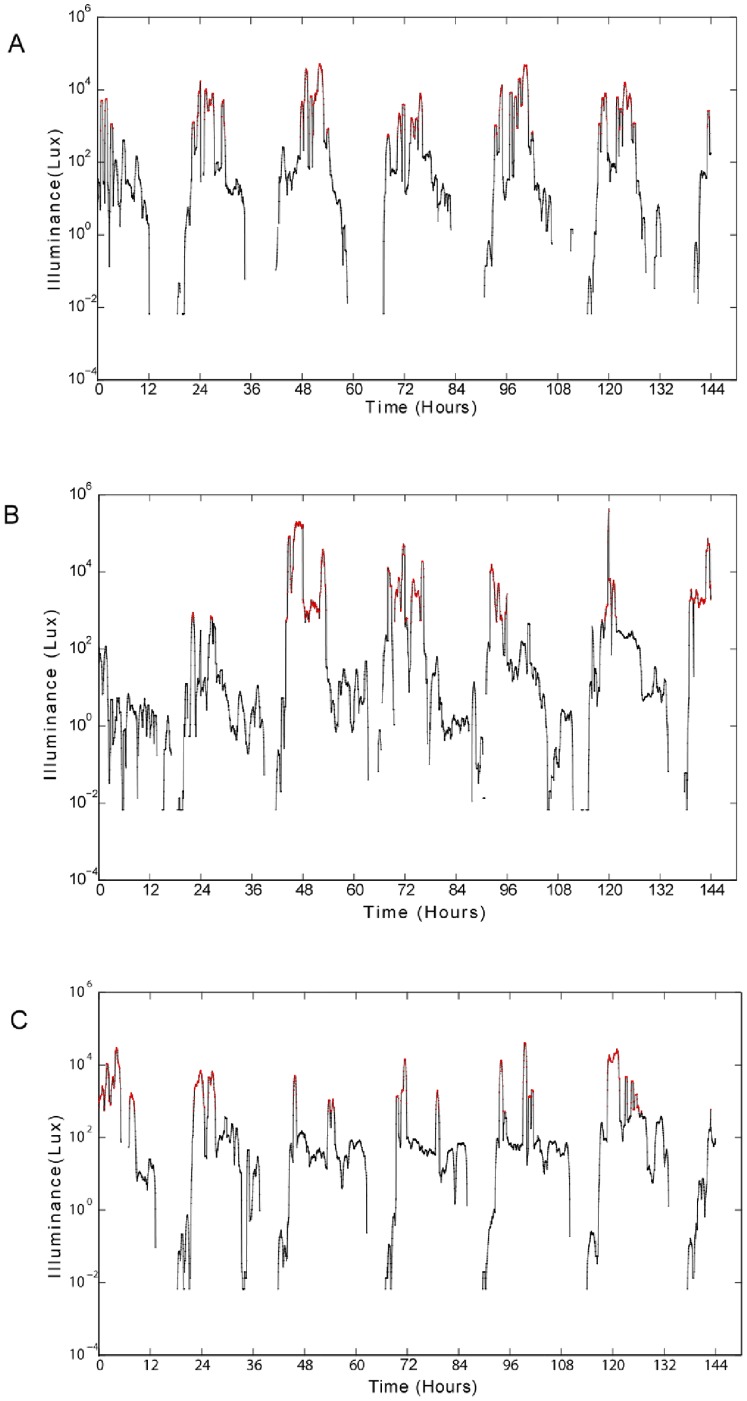
Figure 1. Representative log linear light plots of smoothed data across 7 days from three individual participants.
Light data (lux) for up to 6.5 days is plotted by hour starting at 12 pm on day 1 (hours). The red data points and line indicate when the light level was greater than 500 lux. The data points with a zero lux value are not shown since the log of 0 is not a number.

