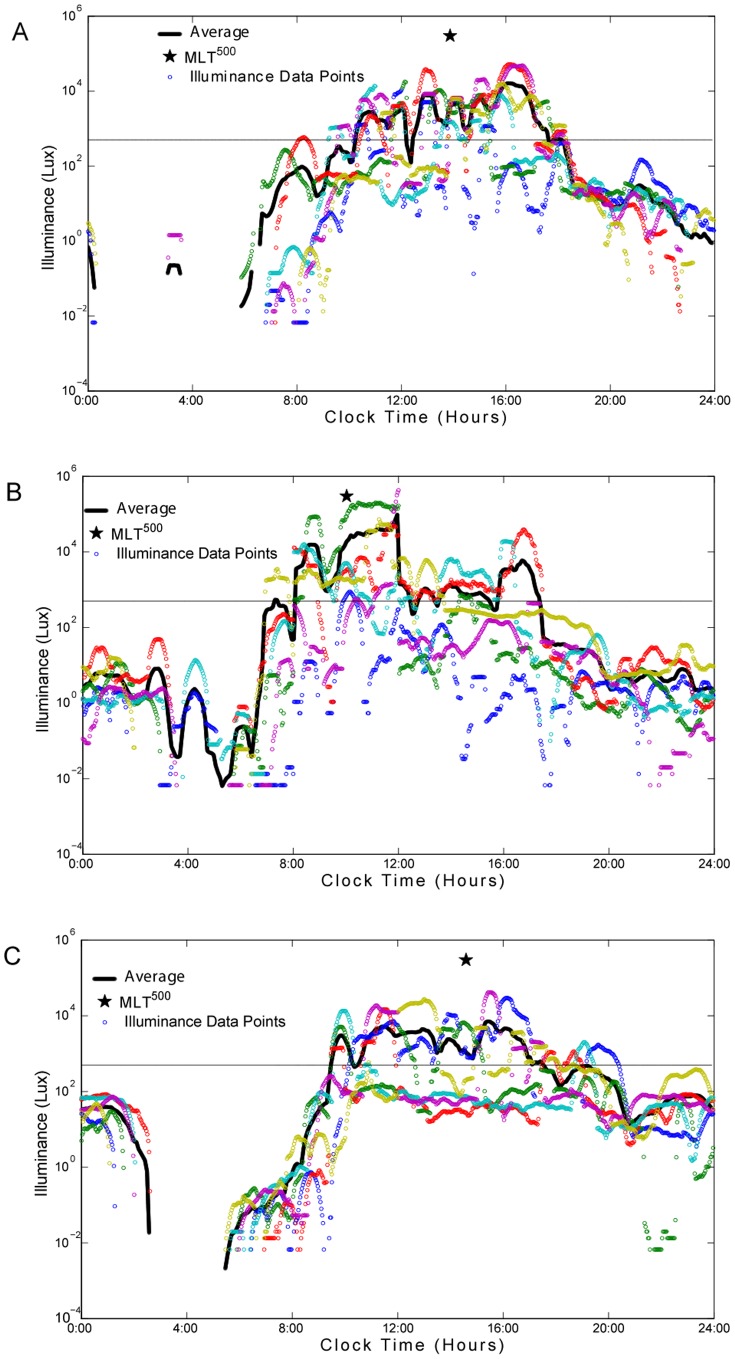
Figure 2. Representative log linear light plots from three individual participants.
Individual light data (lux) for up to 7 days is plotted by time of day (clock time in hours). The smoothed average is shown as a bold line while the MLiT500 is shown as a star, the open circles represent individual illuminance data points and each day is represented as a different color. The 500 lux threshold is shown as a continuous horizontal line. Panels A–C represents light profiles with a range of MLiT500. Areas where there are no data points (night time in Panel A and C) are where the light level readings were zero since the log of 0 is not a number. Panel A, represents an individual with a MLiT500 at 13∶52 hrs; panel B represents an individual with an MLiT500 at 10∶02 hrs and panel C represents an individual with an MLiT500 at 14∶35 hrs.

