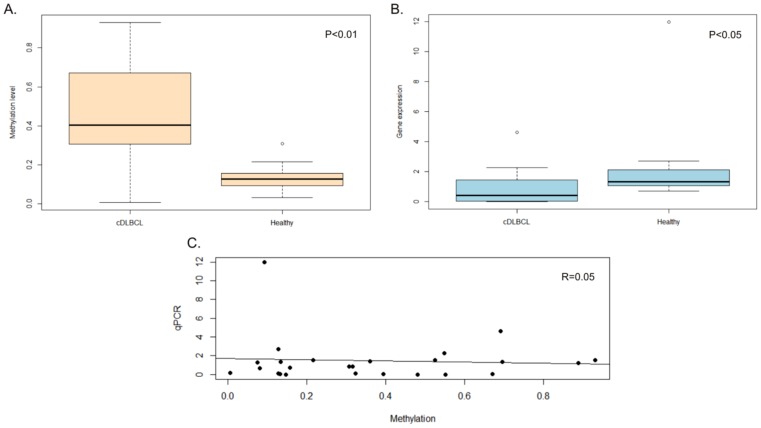
Figure 3. Relationship between TFPI-2 methylation and gene expression levels.
A. Boxplot of TFPI-2 methylation levels measured in DLBCL and Healthy control group. B. Boxplot of TFPI-2 gene expression levels measured in the same samples and C. Correlation between TFPI-2 methylation and its gene expression values.

