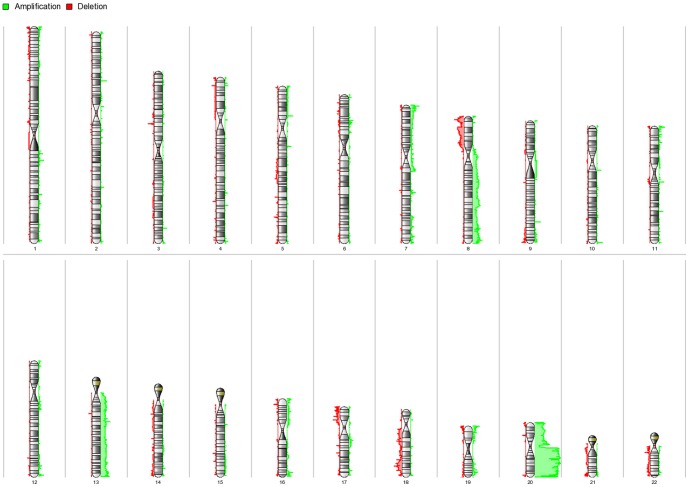
Figure 1. Karyogram view of detected gains and losses regions across autosomes.
Gains are shown in green and losses are shown in red. The length of the horizontal bar corresponds to number of samples involved at the respective cytoband. Most of the gains were found at the long arm of chromosome 20 and losses were mainly observed at the short arm of chromosome 8.

