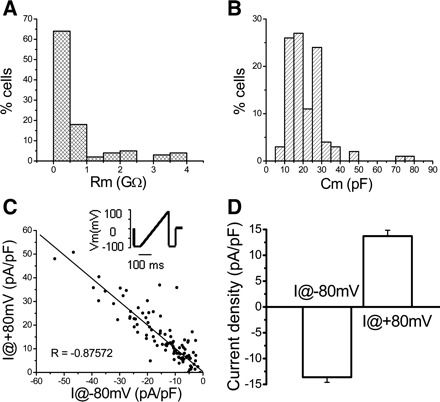
Fig. 1.

Electrophysiological properties of cultured urothelial cells. A: histogram of membrane resistance (Rm; n = 104 cells). B: histogram of membrane capacitance (Cm) for the same cells. C: plot of background currents measured at −80 (x-axis) and +80 mV (y-axis) for individual cells. Data were fitted with a linear function Y = A + B·X, where A is 0.30419 and B is −0.98577. Pearce coefficient of correlation R is −0.87572. Inset: ramp protocol stepping the cell from −100 to +100 mV in 200 ms, every 2 s, from a holding potential of 0 mV. D: average of background currents measured at −80 and +80 mV.
