
Fig. 2.
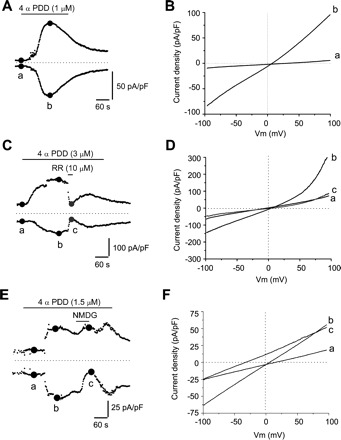
4α-phorbol-12,13 didecanoate (4α-PDD)-elicited currents in cultured urothelial cells. A: representative example of the time course of 4α-PDD-evoked currents measured at ±80 mV using the ramp protocol shown in the inset of Fig. 1C. B: current-voltage (I-V) relationships measured at times indicated by a and b in A, illustrating baseline current (a) and peak current evoked by 4α-PDD (b). C: short application of ruthenium red (RR) during 4α-PDD application reduces both inward and outward currents elicited by 4α-PDD. D: I-V relationships illustrating baseline current (a), peak current evoked by 4α-PDD (b), and the current during RR application (c, grey circles). E: brief replacement of Na+ ions with NMDG during the 4α-PDD exposure reduces the inward current evoked by 4α-PDD. F: I-V relationships recorded at time points indicated in E. In A, C, and E, dotted lines indicate 0 pA/pF.