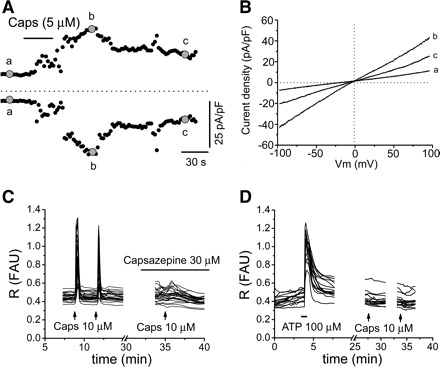
Fig. 4.

Capsaicin-elicited responses in cultured urothelial cells. A: time course of the capsaicin-elicited current. Currents were measured at +80 (top, outward current) and −80 mV (bottom, inward current) during a ramp test protocol shown in inset in Fig. 1C. B: I-V relationships measured at times indicated by a–c in A and illustrating baseline current (a), peak capsaicin current (b), and partial recovery after capsaicin washout (c). C: examples of capsaicin (10 μM applied at the arrow for 30 s)-elicited Ca2+ responses which are blocked by the TRPV1 antagonist capsazepine (30 μM). Each line represents a cell. FAU, fluorescence arbitrary units; R, ratio of fluorescence signal measured at 340 nm divided by the fluorescence signal measured at 380 nm. D: examples of no responses to capsaicin (10 μM) in cells that respond to ATP (100 μM applied at the black horizontal bar for 30 s) used as a control. Each line represents a cell.
