
Fig. 4.
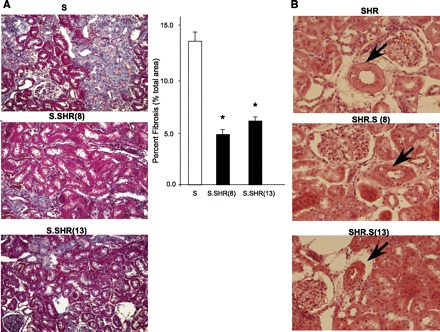
Representative images of key histological features. A: Masson's trichrome staining at ×20 for S vs. S.SHR(8) and S.SHR(13). B: hematoxylin and eosin staining at ×40 for SHR vs. SHR.S(8) and SHR.S(13). For quantitative assessment of interstitial fibrosis in S and S.SHR congenics, 10 random regions of each slide (×20) were evaluated using MetaMorph (Downingtown, PA). Arrows denote arterial vessels. The SHR.S congenics demonstrate vessel thickening and hypercellularity which in the not seen in the SHR parental. Error bars are SE. *Significantly different from S at P < 0.05 by 1-way ANOVA followed by post hoc multiple comparisons using Dunnett's test.