
Fig. 7.
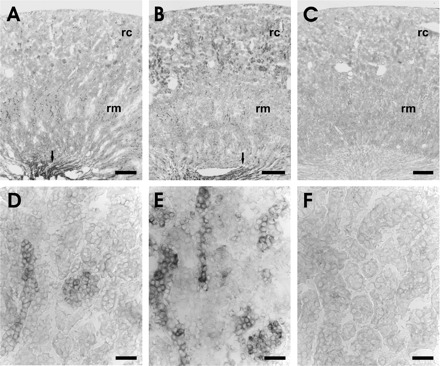
In situ hybridization for SGK1 mRNA on kidney sections of normal and diabetic mice. A and B: overview of SGK1 mRNA expression in the kidney of normal (A) and diabetic mice (B). Arrows point to the strong signals in the collecting duct epithelium of the renal papilla. C: overview of diabetic kidney section hybridized with the sense probe. D and E: higher magnification of the renal cortex of normal (D) and diabetic mice (E). F: higher magnification of the renal cortex of diabetic kidney section hybridized with the sense probe. rc, Renal cortex; rm, renal medulla. Scale bars: A–C, 500 μm; D–F, 20 μm.