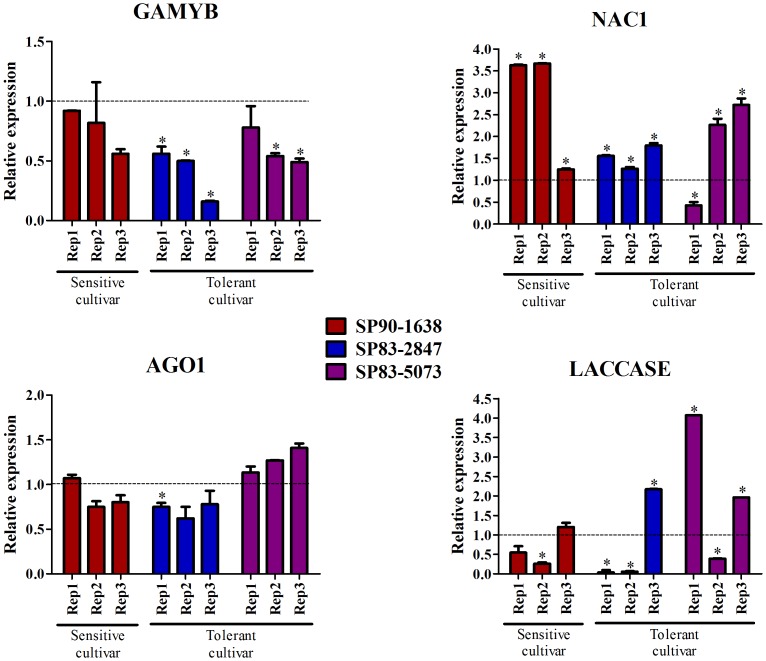
Figure 6. Relative expression profile of miRNA targets.
Analysis of relative expression of miR159 target (GAMYB), miR164 target (NAC1), miR168 target (AGO1) and miR397 target (laccase) by qRT-PCR using samples of three sugarcane cultivar submitted to water depletion. In each case, control condition had relative expression equal 1 (dotted line). *represent significantly changing of miRNA expression between control and treatment samples (p-value <0.05).

