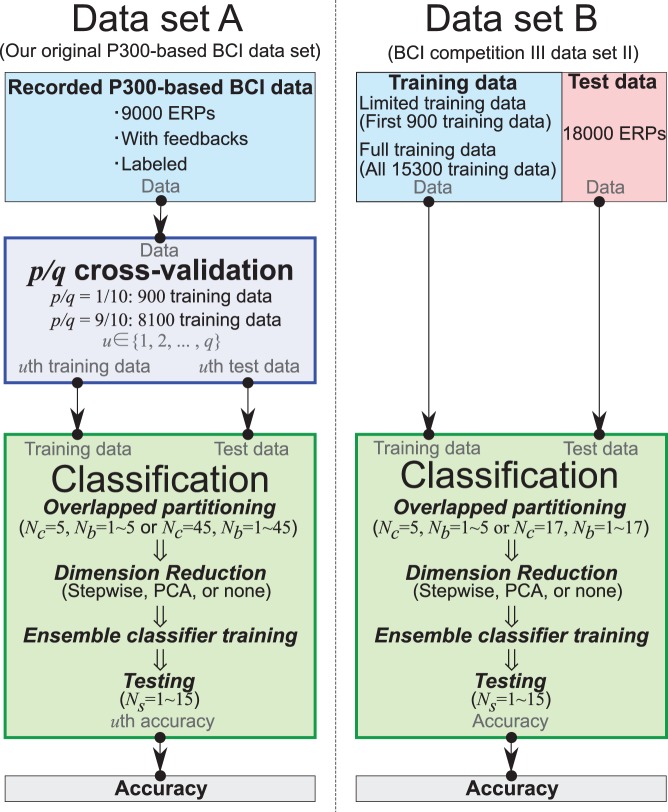
Figure 1. Experimental design.
We analyzed two P300-based BCI data sets A and B respectively. Data set A was recorded in this online experiment. The recorded data set A is divided into  pairs of training and test data by
  cross-validation (see Figure 4). Then the classification is performed for all pairs to compute the classification accuracy (see Figure 5). The overlapped partitioning is employed to train ensemble classifiers. Data set B (BCI competition III data set II) contains separated training data and test data. The data set was also classified by the proposed classifiers.

