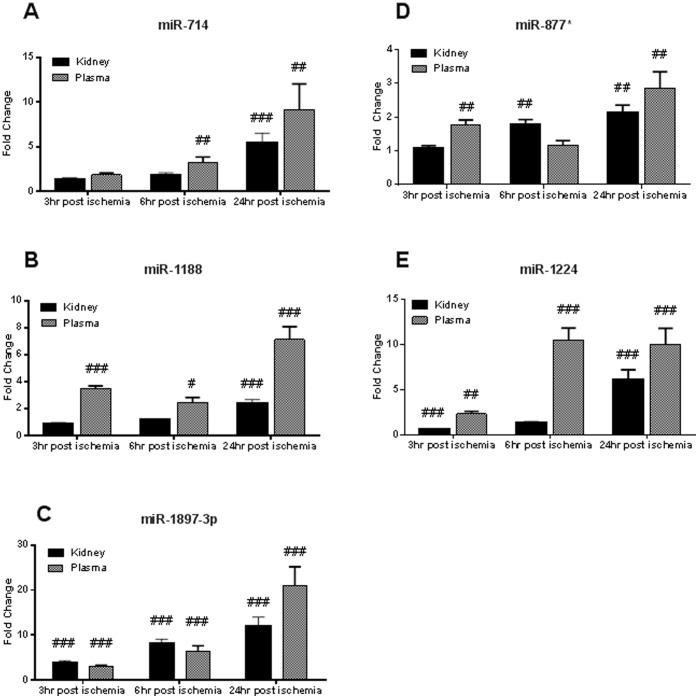
Figure 5. MicroRNA expression confirmation by real-time PCR in the samples from individual animals.
Eleven microRNA species were selected on the basis of concordant and discordant changes in the kidney and plasma as detected in the pooled samples. The changes in five microRNAs were confirmed in the samples from individual animals. Bars on graphs represent fold changes from the time-matched sham-operated animals. MicroRNA expression levels form the sham-operated animals (not shown on graphs) are set to 1. Panel A shows miR-714 changes in kidney and plasma. Panel B shows miR-1188. Panel C shows miR-1897-3p. Panel D shows miR-877*. Panel E shows miR-1224. Two sample t tests were performed on sham and ischemic groups at each timepoint, then p values were adjusted with Bonferroni correction. # = p<0.05; ## = p<0.01; ### = p<0.001.

