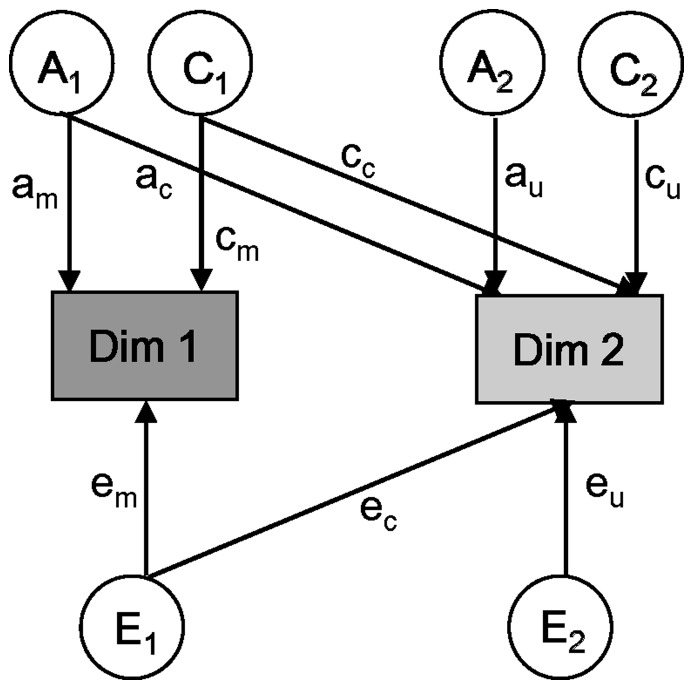
Figure 1. Path diagram illustrating the bivariate genetic model.
Note. Dim = dimension. Dim 1/2 represents either one of the two narcissistic dimensions, grandiosity and entitlement. Measured variables are depicted in rectangles. Latent factors A (additive genetic factor), C (shared environmental factor), and E (non-shared environmental factor) are presented in circles. c = common; u = unique; m = main (main influence on the first measured variable from A1/E1).

