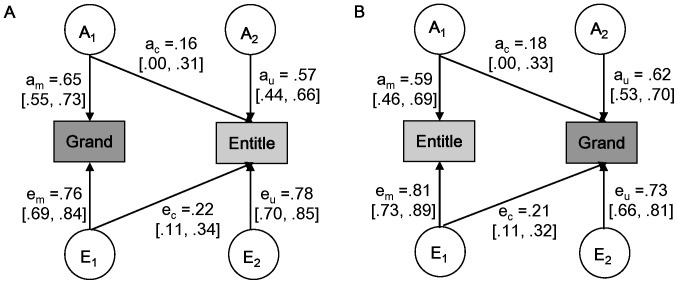
Figure 2. Bivariate genetic analysis of grandiosity and entitlement.
Note. A) The best fitting bivariate model for influences from grandiosity to entitlement. B) The best-fitting bivariate model for influences from entitlement to grandiosity. Grand = Grandiosity; Entitle = Entitlement. Measured variables are depicted in rectangles. Latent factors A (additive genetic factor) and E (non-shared environmental factor) are presented in circles. c = common; u = unique; m = main (main influence on the first measured variable from A1/E1). Standardised (unsquared) path estimates and 95% confidence intervals are included. All the path estimates are obtained from the best fitting model, i.e., AE model.

