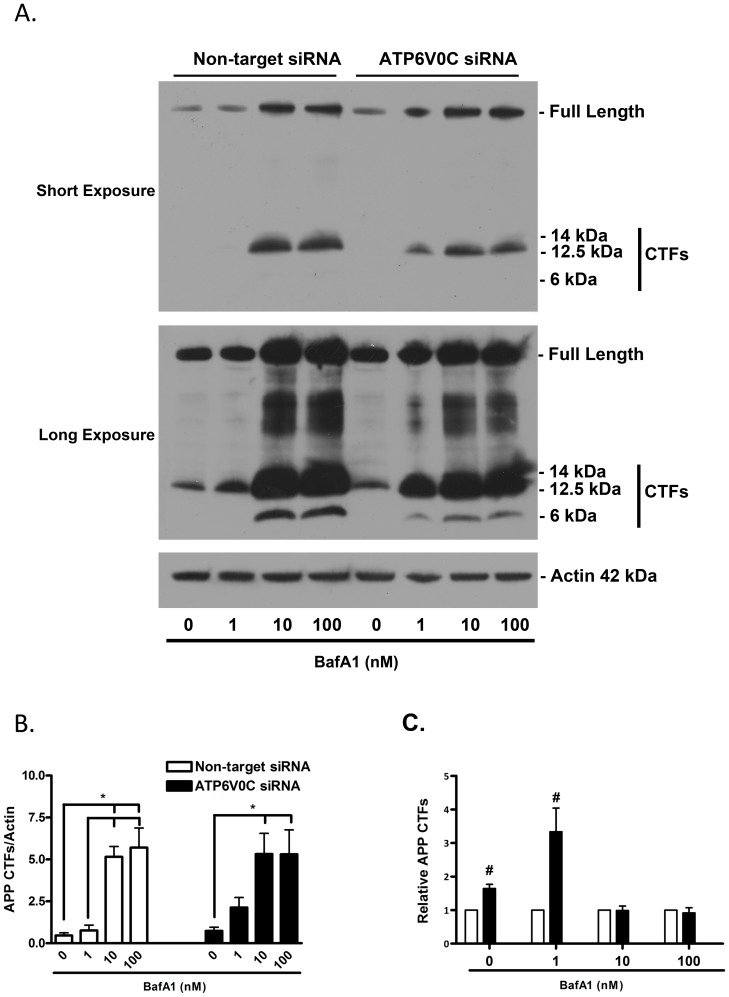
Figure 5. ATP6V0C regulates basal and stress-induced metabolism of APP.
Representative western blot (A) for amyloid precursor protein C-terminal fragments (APP CTFs) from nucleofected cells following 48 h treatment with 0–100 nM bafilomycin A1 (BafA1). An antibody was used that recognized both full-length APP (∼110 kDa) and APP CTFs (≤15 kDa). Sizes indicated for CTFs are predicted relative to migration of molecular weight marker and correlate to sizes as previously published (please see results section for further information). In addition to a short-exposure (5 min) blot, a long-exposure (2 h) blot is shown to indicate APP CTFs in vehicle-treated cells. Blots were stripped and re-probed for actin (42 kDa) to normalize for gel loading. APP CTFs from long-exposure blots quantified from four independent experiments are expressed graphically (B–C). Within groups comparisons of BafA1 concentration responsiveness (Non-target siRNA, open columns, left; ATP6V0C siRNA, filled columns, right) were determined (B) by expressing mean ± SEM band intensities relative to actin loading control. All lines above columns indicate significant within-group differences with respect to concentration (*p<0.05 using one-way ANOVA and Bonferroni's post-hoc test). Comparisons between groups (Non-target vs. ATP6V0C siRNA) were determined for each concentration of BafA1 by expressing mean ± SEM fold changes for each ATP6V0C siRNA condition relative to its companion Non-target control. #p<0.05 vs. corresponding Non-target siRNA control using one-sample t-test.

