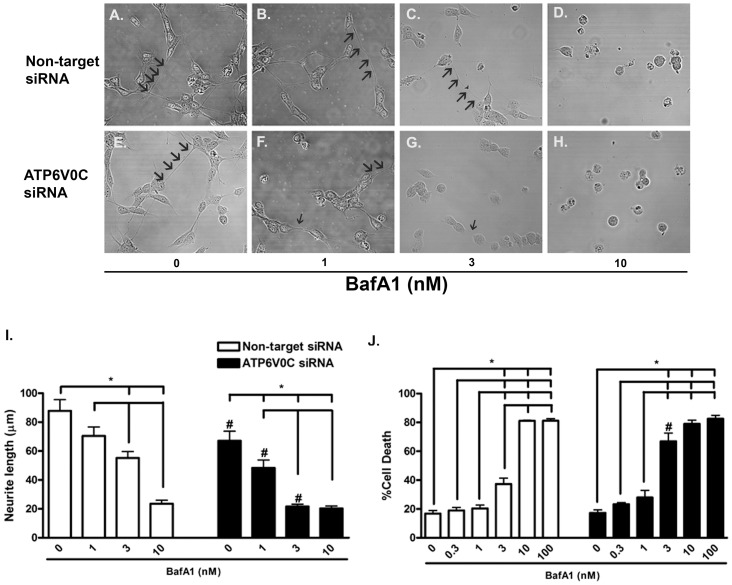
Figure 6. ATP6V0C knockdown exhibit enhanced markers of cytotoxicity.
Representative confocal microscopy images obtained from differentiated SH-SY5Y cells following nucleofection with Non-target (A–D) or ATP6V0C (E–H) siRNA and subsequent treatment for 48 h with 0 (A, E), 1 (B, F), 3 (C, G) or 10 (D, H) nM bafilomycin A1 (BafA1). Arrows indicate neuritic processes. Scale bar = 50 μm. Neurite length (μm) is expressed graphically (I) and represents results (mean ± SEM) from three independent experiments (10 cells per condition in each experiment). Percent cell death (percentage of propidium iodide (PI)-positive cells quantified using flow cytometry) is expressed graphically (J) as mean ± SEM with data obtained from a total of nine independent experiments. All lines above columns indicate significant within-group differences with respect to concentration (*p<0.05 using one-way ANOVA and Bonferroni's post-hoc test). Comparisons between groups (Non-target vs. ATP6V0C siRNA) were determined for each concentration of BafA1 using two-sample t-test (#p<0.05).

