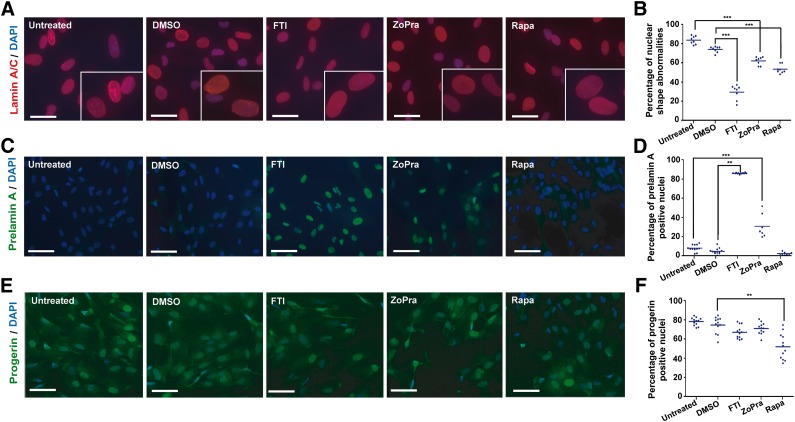
Figure 3.
Effect of the different pharmacological treatments on nuclear shape abnormalities, prelamin A maturation, and progerin expression. (A): Lamin A/C staining (JOL2) in mesodermal stem cells derived from Hutchinson-Gilford progeria syndrome induced pluripotent stem cells (HGPS MSCs) following 72 hours of treatment in a cumulative dose. Scale bars = 25 μm. (B): Quantification of misshapen nuclei in HGPS MSCs following 72 hours of treatment in a cumulative dose. Each plot represents the percentage of abnormal nuclei, and the horizontal bar represents the mean value of each condition. (C): Prelamin A immunostaining in HGPS MSCs following 72 hours of treatment in a cumulative dose. Scale bars = 30 μm. (D): Automated quantification of prelamin A-stained nuclei in HGPS MSCs following 72 hours of treatment in a cumulative dose. Each plot represents the percentage of prelamin A-positive nuclei, and the horizontal bar represents the mean value of each condition. (E): Progerin immunostaining in HGPS MSCs following 72 hours of treatment in a cumulative dose. Scale bars = 30 μm. (F): Automated quantification of progerin-stained nuclei in HGPS MSCs following 72 hours of treatment in a cumulative dose. Each plot represents the percentage of progerin-positive nuclei, and the horizontal bar represents the mean value of each condition. Abbreviations: DAPI, 4′,6-diamidino-2-phenylindole; DMSO, dimethyl sulfoxide; FTI, farnesyltransferase inhibitor; Rapa, rapamycin; ZoPra, zoledronate and pravastatin.

