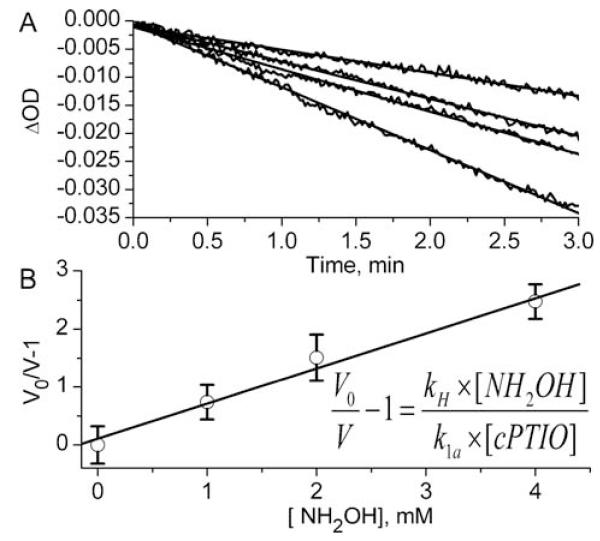
Figure 4.
The measurement of the rate constant of the reaction of cPTIO with HNO using NH2OH as competitive agent. (A) The decrease of absorbance at 299 nm in the mixture of 0.3 mM cPTIO and 0.3 mM hcPTIO measured after addition of 0.5 mM Angeli’s salt in the presence of various concentrations of NH2OH. Lines represent linear fits yielding the rates of hcPTI formation to be equal to 31, 21, 18, and 11 μM/s for 0, 1, 2, and 4 mM NH2OH, correspondingly (from bottom upwards). (B) The dependence of (V0/V-1) term on NH2OH concentration calculated from Figure 4A. Line represents linear fit yielding k1a = (5.5±0.9)×kH.

