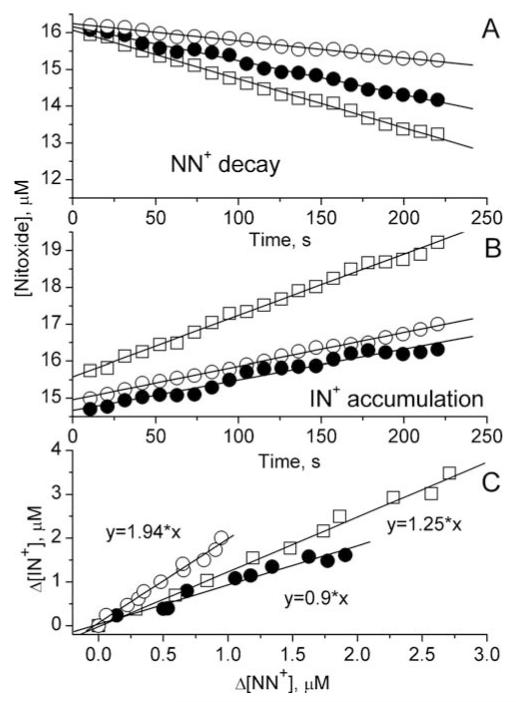
Figure 7.
EPR monitoring of •NO and/or HNO release by liposome-encapsulated detection system (0.5 mM NN+, 0.5 mM IN+ and 5 mM hIN+). The kinetics of NN+ decay (A) and IN+ accumulation (B) were measured after initiation of •NO or/and HNO generation by addition of 18 μM PAPA NONOate (○), 11 μM AS (•), or PAPA NONOate and AS together (□). Solid lines in panels A and B represent linear fits yielding the rates of NN+ decay and IN+ accumulation presented in the Table 1. Panel C shows the dependences of Δ[IN+] on Δ[NN+] calculated from the data in panels A and B.

