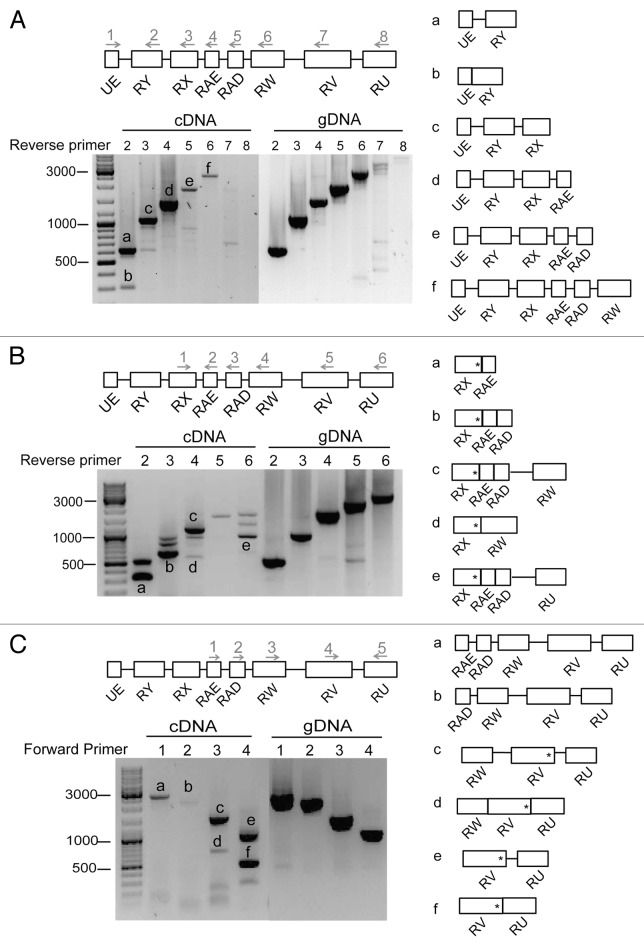
Figure 4. The mod(mdg4) anti-sense transcripts. (A) RT-PCR of the anti-sense transcripts in S2 cells. The image shows an example of an agarose-gel electrophoresis of the RT-PCR products. The lengths of molecular mass standards are shown to the left, in bp. A forward primer located at UE (primer 1) was combined with different reverse primers downstream (primers 2 to 8), as indicated in the figure. The primer pairs were used to amplify different regions of the transcript in cDNA prepared from S2 cells. Genomic DNA (gDNA) was used in parallel to monitor the efficiency of the PCR reactions. The major PCR products (bands a–f) were purified and sequenced. The right part of the figure shows the exon-intron composition of the sequenced bands. (B) RT-PCR analysis as in (A). In this case, the forward primer at RX (primer1) was combined with different reverse primers downstream (primers 2 to 6). In spite of their different length and exon composition, all these transcripts have a translation termination codon within the RX exon (asterisk). (C) RT-PCR analysis as in (A). Different forward primers (primers 1 to 4) and one reverse primer (primer 5) were used to amplify anti-sense transcripts. Translation termination codons are shown as asterisks.

An official website of the United States government
Here's how you know
Official websites use .gov
A
.gov website belongs to an official
government organization in the United States.
Secure .gov websites use HTTPS
A lock (
) or https:// means you've safely
connected to the .gov website. Share sensitive
information only on official, secure websites.
