
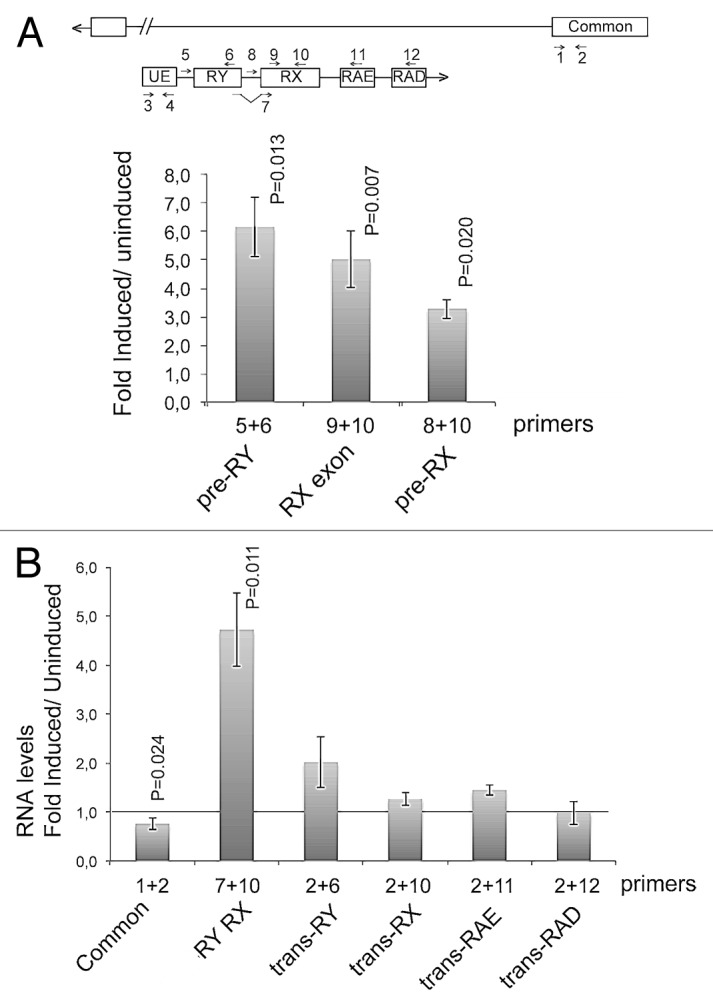
Figure 6. Overexpression of an anti-sense mod(mdg4) transcript. A genomic sequence expanding from TSS1 to CS6 was cloned into an expression vector under the control of an inducible promoter and transfected into S2 cells. The effect of the overexpression of the anti-sense RNA on the levels of several mod(mdg4) RNAs was measured by RT-qPCR. (A) The expression of the anti-sense transcript was induced by treating the stably transfected S2 cells with 200 µM CuSO4. The abundance of the anti-sense transcript was measured by RT-qPCR using different primer combinations to quantify different parts of the transcript, as indicated in the figure. The transcript abundances were calculated relative to Act5C mRNA abundance in the same samples. Uninduced cells were analyzed in parallel and used as a reference. The histogram shows the changes in transcript abundance expressed as fold change relative to the levels in uninduced cells. The bars represent averages and the error bars represent standard deviations from three independent experiments. The statistical significance of the changes observed between induced and uninduced cells was assessed using a two-tailed, paired Student’s t test. Significant P values (< 0.05) are given in the figure. (B) The effect of the overexpression on the abundances of cis-spliced and trans-spliced transcripts was quantified as in (A). The abundance of the common exons was quantified in parallel and was slightly reduced. The abundance of an anti-sense trancript containing the RY and RX exons (RY RX) was increased significantly. The abundance of the trans-spliced transcripts was not significantly changed (P > 0.05).