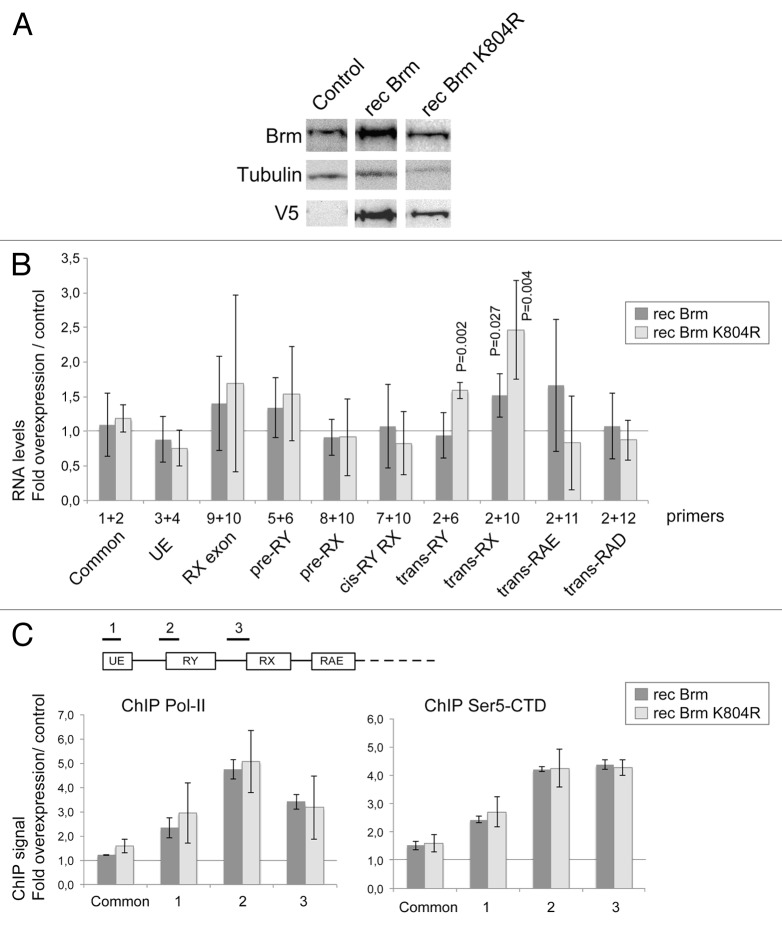
Figure 7. The overexpression of BRM promotes RX trans-splicing. S2 cells were stably transfected with plasmids expressing either wild-type BRM (recBRM) or the ATPase mutant recBRM-K804R. (A) The expression of the recombinant BRM proteins was induced with 200 µM CuSO4 for 24 h and assessed by western blotting using anti-BRM and anti-V5 antibodies. Control S2 cells were analyzed in parallel. Tubulin was used as a loading control. (B) The relative abundances of selected mod(mdg4) transcripts were quantified by RT-qPCR in cells that overexpressed BRM and in control cells. The PCR primers were the same as in Figures 5 and 6. In all cases, the RNA levels were calculated relative to Act5C. The ratios between cells that overexpressed recBRM or recBRM-K804R and control cells are presented in the histogram. The bars represent averages from four independent experiments. The error bars represent standard deviations. Significant P values (< 0.05, two-tailed, paired Student’s t test) are given in the figure. The other changes are not significant. (C) ChIP analysis of the effect of BRM overexpression on the density of Pol-II. The expression of recBRM or recBRM-K804R was induced as above, and chromatin was prepared 24 h after induction. ChIP experiments using an antibody against the CTD of Pol-II were used to quantify the density of Pol-II (left panel). The levels of Pol-II-CTD phosphorylated at Ser5 (Ser5-CTD) were quantified in ChIP experiments using a Ser-5P specific antibody (right panel). Three different genomic regions within the anti-sense region 1 were analyzed, as indicated in the figure. The density of Pol-II at the upstream sense promoter (Common) was also analyzed. The ChIP signals were quantified by qPCR using a standard curve for each primer pair. The values obtained in negative control reactions without primary antibody were substracted, and the resulting signals were referred to input levels and expressed as fold change in cells overexpressing BRM relative to control cells. The histograms show average folds and the error bars represent standard deviations calculated from three independent experiments.

An official website of the United States government
Here's how you know
Official websites use .gov
A
.gov website belongs to an official
government organization in the United States.
Secure .gov websites use HTTPS
A lock (
) or https:// means you've safely
connected to the .gov website. Share sensitive
information only on official, secure websites.
