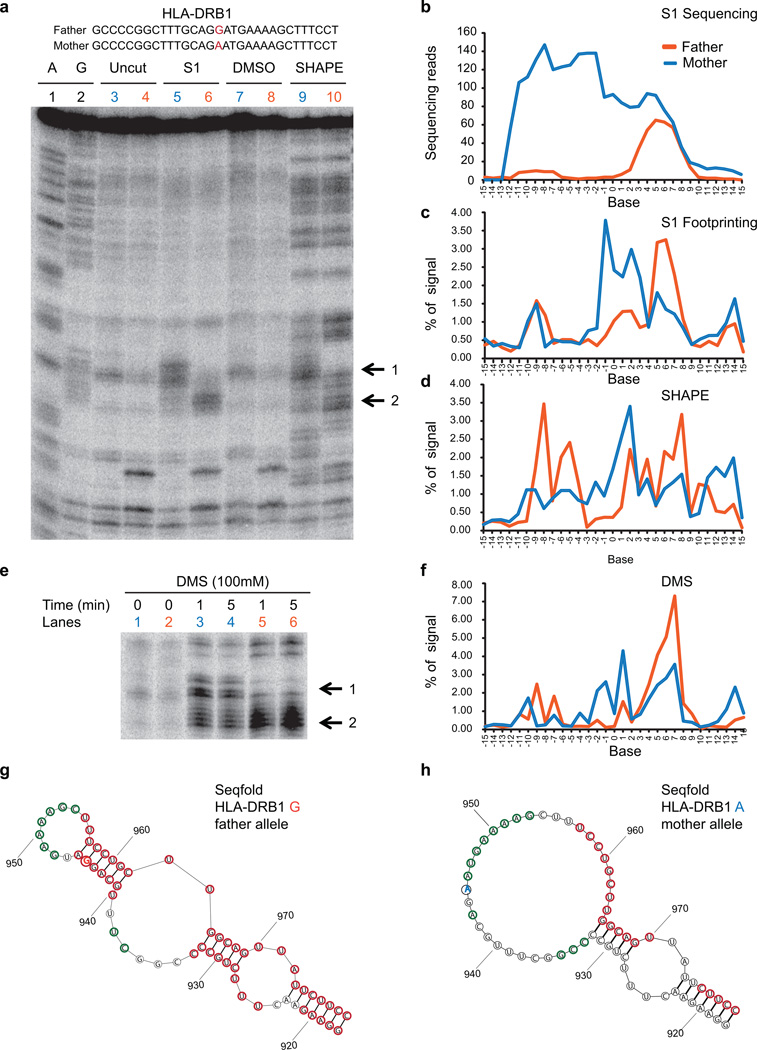
Extended Data Figure 7. Footprinting validation of a RiboSNitch in HLA-DRB1 transcript identified by PARS.
a, The sequence of a portion of the transcript containing the RiboSNitch was shown. The RiboSNitch is in red. Gel analysis of 2 fragments of HLA-DRB1 RNA A and G alleles using S1 nuclease (lanes 5 (Mother), 6 (Father)), and SHAPE probing ((lanes 9 (Mother), 10 (Father)). Additionally, sequencing lanes (lanes 1,2), uncut lanes (lane 3 (Mother), lane 4 (Father)), and DMSO treated lanes (lane 7 (Mother), lane 8, (Father)) are also shown. Black arrows indicate the change in structure between the Father and Mother alleles. b, S1 sequencing reads across the RiboSNitch for both Father and Mother. c,d, SAFA quantification of the RNA footprinting of both alleles using S1 nuclease (c) and SHAPE (d). e, Gel analysis of 2 fragments of HLA-DRB1 RNA A and G alleles using DMS (lanes 1,3 and 4 (Mother), 2, 5 and 6 (Father)). Black arrows indicate the change in structure between Father and Mother alleles. f, Quantification of DMS footprinting of both HLA-DRB1 alleles using SAFA. g,h, Secondary structure models of the G alelle (g) and A allele (h) of HLA-DRB1, using Seqfold guided by PARS data. The 2 alleles of the ribosnitch is shown in orange and blue respectively. The red and green circles indicate bases with PARS scores >=1 and <= −1 respectively.

