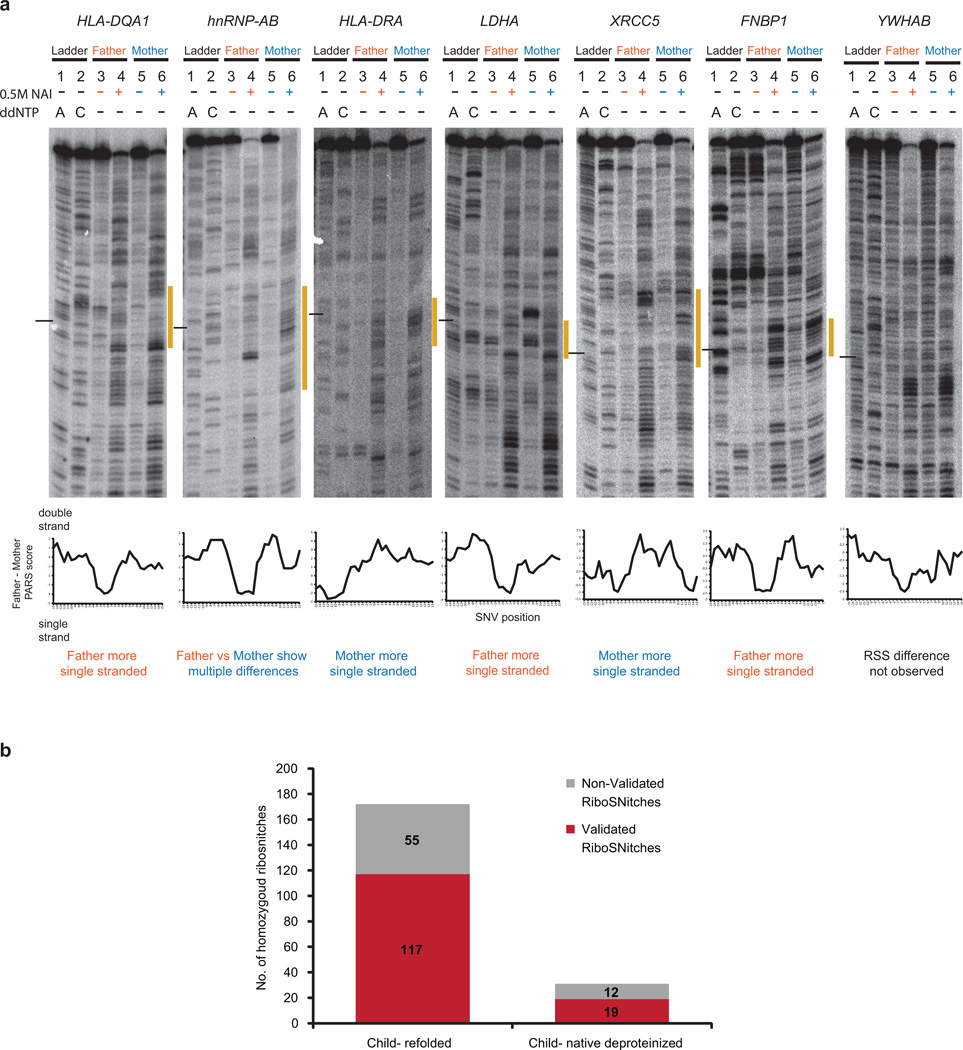
Extended Data Figure 9. Additional footprinting validation of RiboSNitches.
a, Top: Gel analysis of fragments of Father and Mother alleles of HLA-DQA1, hnRNP-AB, HLA-DRA, LDHA, XRCC5, FNBP1, and YWHAB using SHAPE (lanes 4 (Father), 6 (Mother)). Additionally, DMSO controls (lanes 3 (Father),5 (Mother)) and ladder lanes (lanes 1 (T ladder), 2 (G ladder)) are also shown. The black line indicates the position of the SNV. The yellow bar along the side of the gel indicates the region that is changing between the father and mother alleles. Bottom: Difference in PARS signal between Father (GM12891) and Mother (GM12892), centred at the RiboSNitch. Positive PARS score indicates double stranded RNA, and should correspond to lower SHAPE signal. Negaitive PARS score indicates unpaired RNA with correspondingly higher SHAPE signal. 6 out of 7 cloned RNAs are validated by SHAPE in vitro. hnRNP-AB showed mulitple differences surrounding the SNV; SHAPE data confirmed the RiboSNitch and showed the structural rearrangement is more complex than indicated by PARS. SHAPE data of YWHAB did not show the predicted RSS difference. b, Bar graphs showing the number of homozygous SNVs in parents that are validated (in red) and not validated (grey) in the child by allele specific mapping. Homozygous RibiSNitches between the father and mother are mapped to both the renatured child RNA (in vitro-child) and the native deproteinized child RNA (native deproteinized-child). As the depth of coverage is lower in native deproteinized samples, we detect fewer (31) SNVs that were homozygously different in the parents.

