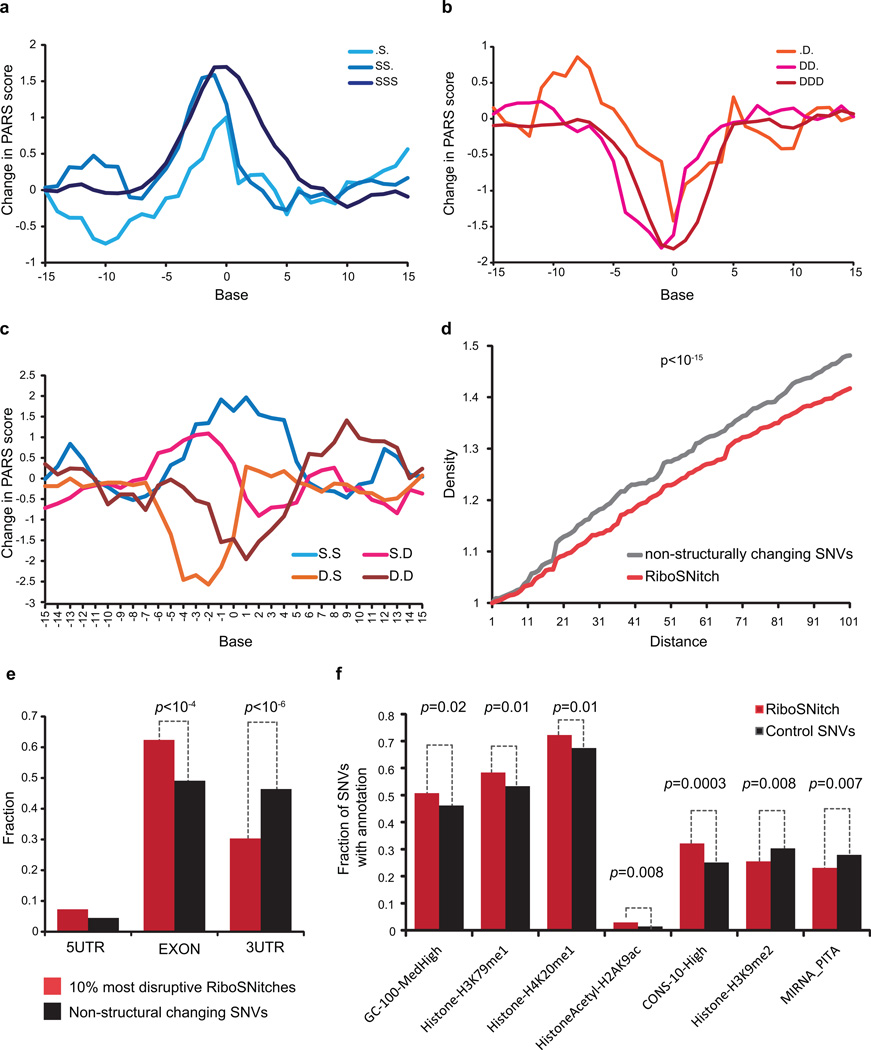
Extended Data Figure 10. Properties of Ribosnitches.
a,b, Average PARS score difference around SNVs that originally reside in increasingly single stranded (a) or increasingly double stranded (b) region. c, Average PARS score difference around SNVs that were flanked by both double stranded bases, both single stranded bases, or one single and one double stranded base on each side. d, Density of other SNVs centered around RiboSNitches versus a control group of 2450 non-structure changing SNVs. P-value calculated by Kolmogorov-Smirnov Test. e, Distribution of top 10% most structurally disruptive RiboSNitches, calculated by biggest structural difference between the 2 alleles, versus a control group of 1855 SNVs that do not change structure in 5’UTRs, CDS and 3’UTRs. f, Different genomic features or annotations of 993 unique RiboSNitches are compared to 1009 control SNVs. For each genomic annotation, the fraction of RiboSNitches that reside in the genomic region covered by the annotation (e.g., histone mark) was compared to the fraction of control SNVs by Student’s t-test. A cutoff value of p=0.05 (T-test) was used.

