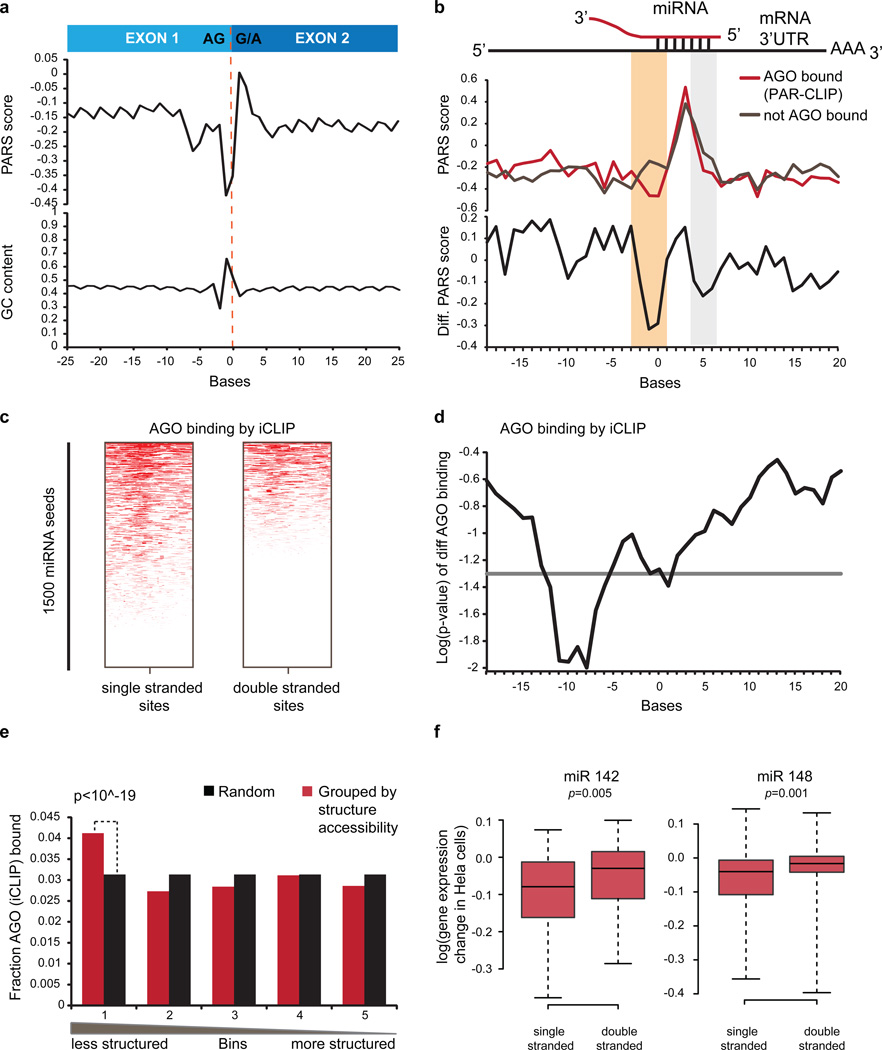
Figure 2. RSS signatures of post-transcriptional regulation.
a, Average PARS score and GC content across transcript exon-exon junctions. b, Average PARS score (Top) and PARS score difference (Bottom) across miRNA sites for AGO-bound (red) vs. non-AGO-bound sites (grey). Structurally different regions are in beige and light grey. c, AGO-iCLIP binding for single vs. double-stranded miRNA target sites. d, P-value for differential AGO-iCLIP binding (t-test, p=0.05 in grey). e, Observed vs. expected AGO binding (p-value, chi-square test). f, Expression changes of mRNAs with accessible and inaccessible miR142 (left) or miR148 (right) sites, upon miRNA over-expression (Wilcoxon Rank sum test).

