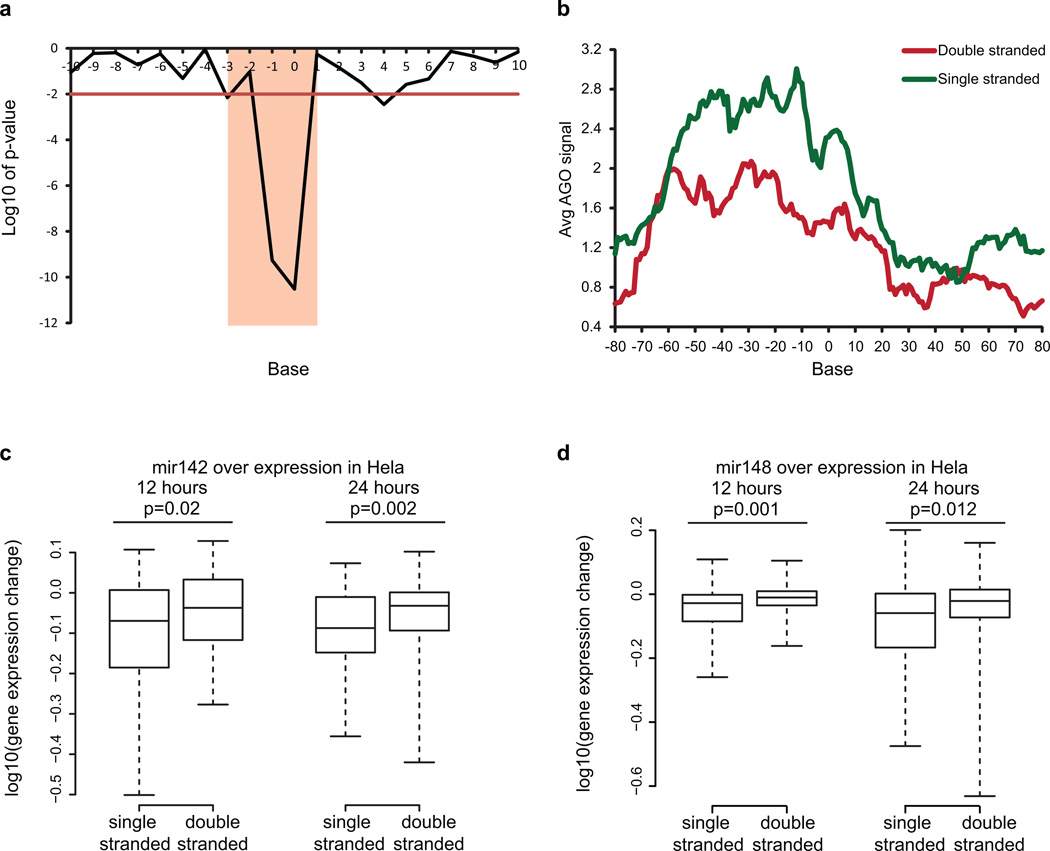
Extended Data Figure 4. Increased accessibility 5’ of miRNA target site influences AGO binding.
a, Bases that show significantly different PARS score between AGO bound and non-bound sites in PAR-CLIP. Base 0 is the most 5’ position of the mRNA that is directly base-pairing with miRNA seed region. Y axis indicates log10 of p-value, calculated by Wilcoxon Rank Sum Test. b, Metagene analysis of the average AGO bound reads using iCLIP in predicted miRNA target sites that are single stranded (green) or double stranded (red) from bases −3 to 1. c,d, Average PARS score is calculated for bases −3 to 1 for each targetscan predicted site. Change in gene expression is plotted for genes with most accessible (100) and least accessible (100) sites, upon over expression of miRNA 142 (c) and miRNA 148 (d). P-value is calculatedusing Wilcoxon Rank Sum Test.

