
Fig. 4.
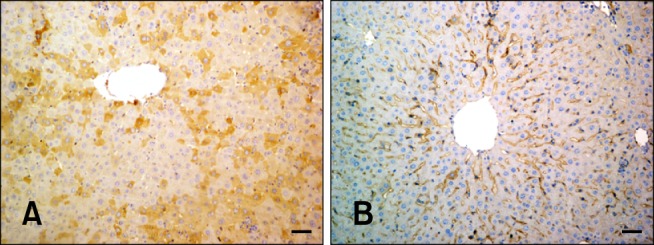
VEGF expression in hepatocytes from the experimental and control groups. (A) Cytoplasmic VEGF immunolabeling (Group 4B). (B) VEGF staining shown in panel B was significantly decreased compared that observed in panel A (Group 6C). Scale bars = 44 µm.