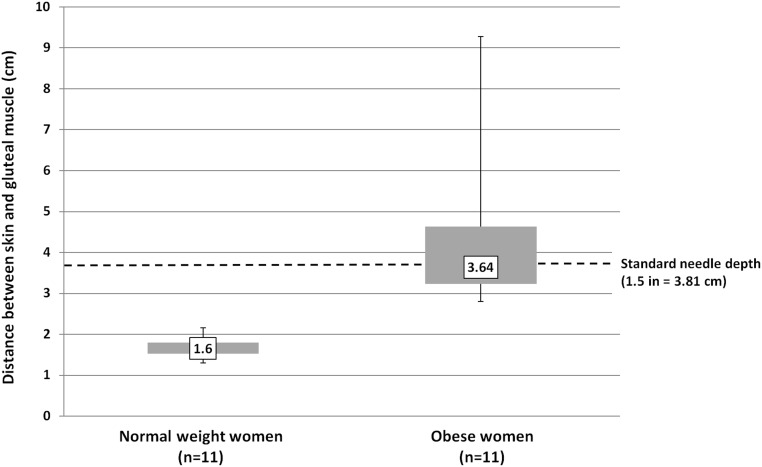
Figure 2.
Distance between skin and gluteal muscle in normal and obese participants. Shaded boxes represent the interquartile range (Q1–Q3). Whiskers indicate minimum and maximum values. Median values are marked, and the difference is statistically significant (P < .001) using the Wilcoxon rank sum (Mann-Whitney U) test. Depth penetrated by a standard 1.5-in. needle is indicated with a dotted line.

