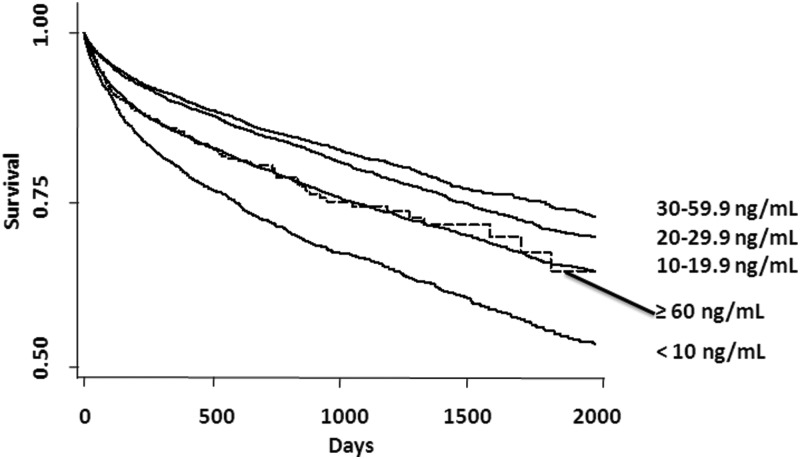
Figure 1.
Time-to-event curves for all-cause mortality. Unadjusted event rates were calculated with the use of the Kaplan-Meier methods and compared with the use of the log-rank test. Categorization of 25(OH)D is per the primary analyses with 25(OH)D 60–69.9 ng/mL and 25(OH)D ≥70.0 ng/mL groups shown as ≥60.0 ng/mL. The global comparison log rank P value is <.0001.

