
Figure 3.
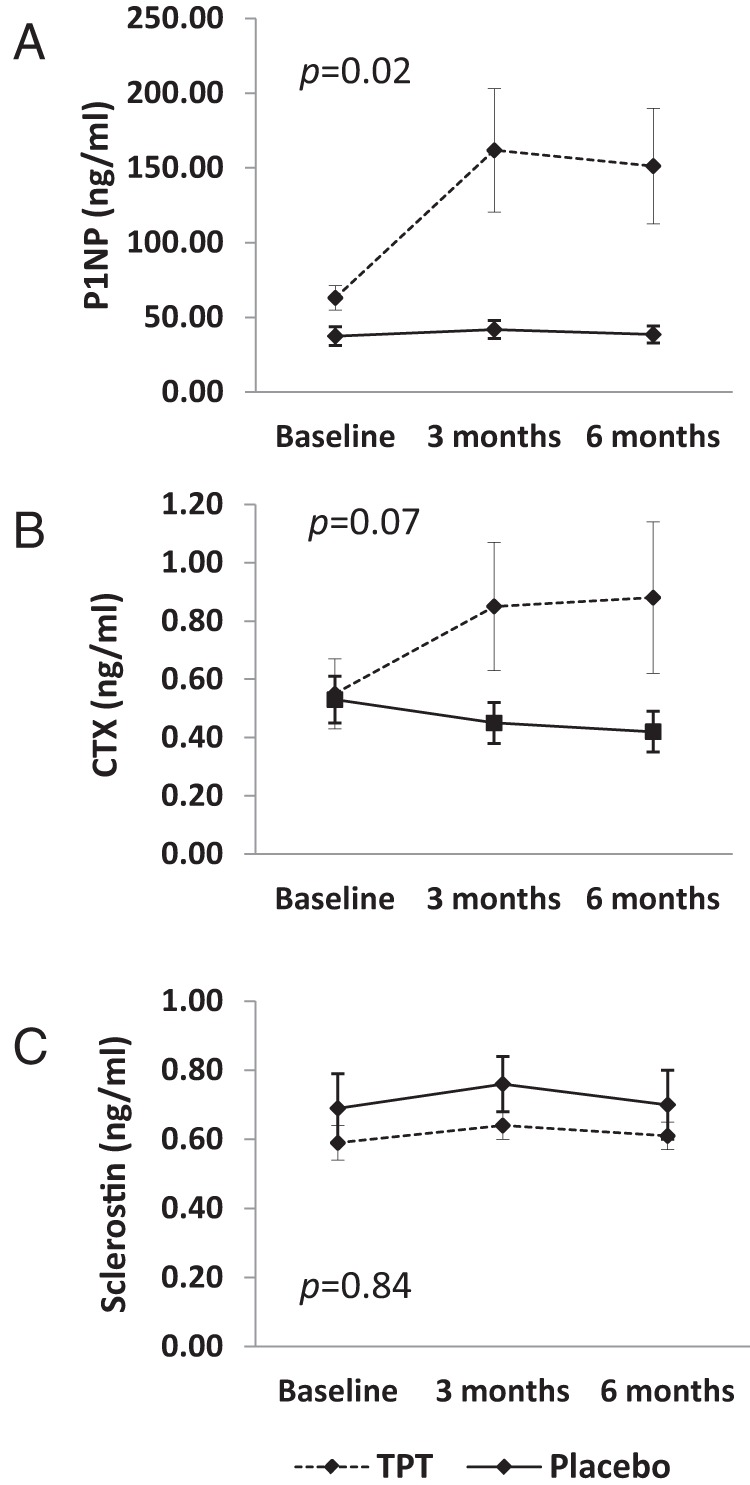
A, P1NP levels increased after 3 months and remained at this higher level in the group receiving TPT, whereas levels remained stable in the group receiving placebo (P = .02 for group × time interaction). B, CTX levels also increased after 3 months of TPT and remained at this higher level at 6 months, whereas they remained stable in the placebo group; however, this difference in the pattern of change of CTX levels was not statistically significant (P = .07 for group × time interaction). C,Serum sclerostin levels remained stable in both groups over the 6-month study period. All P values represent group × time interaction.