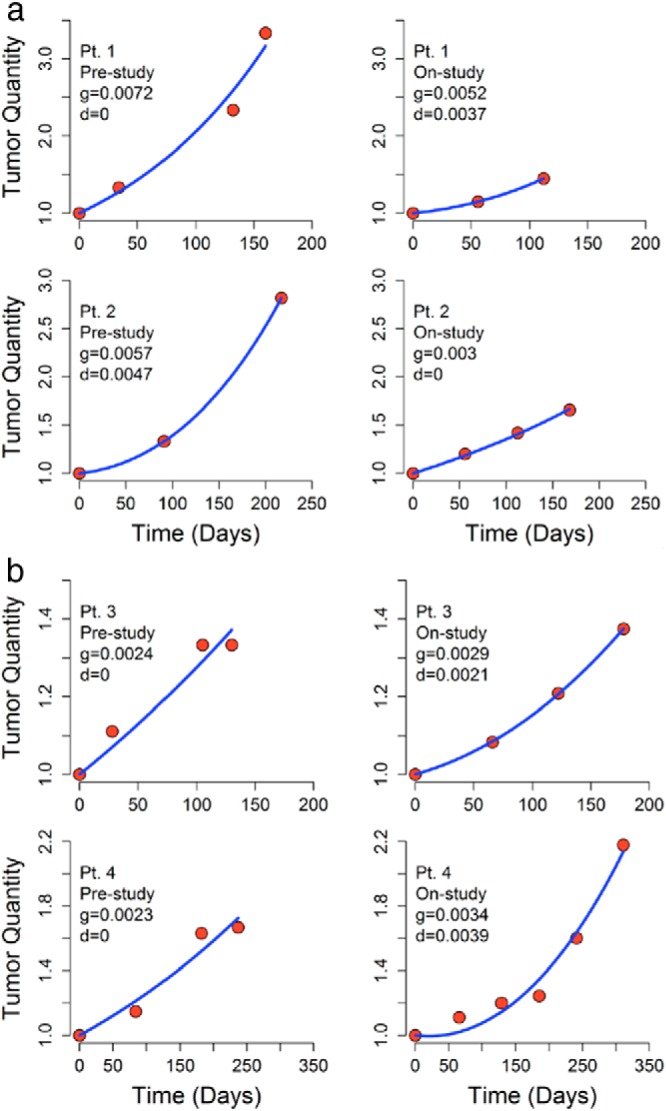
Figure 1.

Graphical presentation of tumor quantities over time in four patients enrolled in the axitinib trial. The data represent the sum of the longest diameters of the same tumor masses, both before the study and on-study. The curve fits allow one to calculate the growth (g) and regression (d) rate constants that describe the simultaneous occurrence of growth of resistant tumor cells and regression of sensitive cells. In the two upper panels, one can see the results in two patients (patient 7 above and patient 9 below) in whom the rate of tumor growth decreased while on axitinib. The two in the lower panels (patient 4 above and patient 11 below) did not experience a decrease in the rate of their tumor growth. Note that in all cases the quantity of tumor has continued to increase. There is only a difference in the rate of growth, not in the amount of tumor. Note also the x-axes are different.
