
Figure 2.
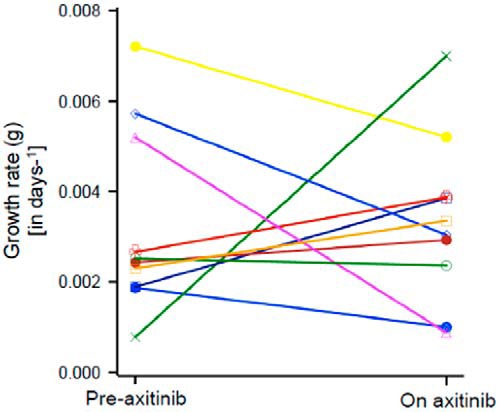
Summary of data such as that depicted in Figure 1 for 10 of the 13 patients enrolled on the axitinib study. The growth rate (in days−1) is shown. The rate fell in four patients but in the other six it remained unchanged or even increased. Because not all patients were being followed up without treatment, an increase can occur if the prior therapy was able to slow tumor growth better than axitinib. Again, note this is the rate of growth, not the absolute tumor quantity.