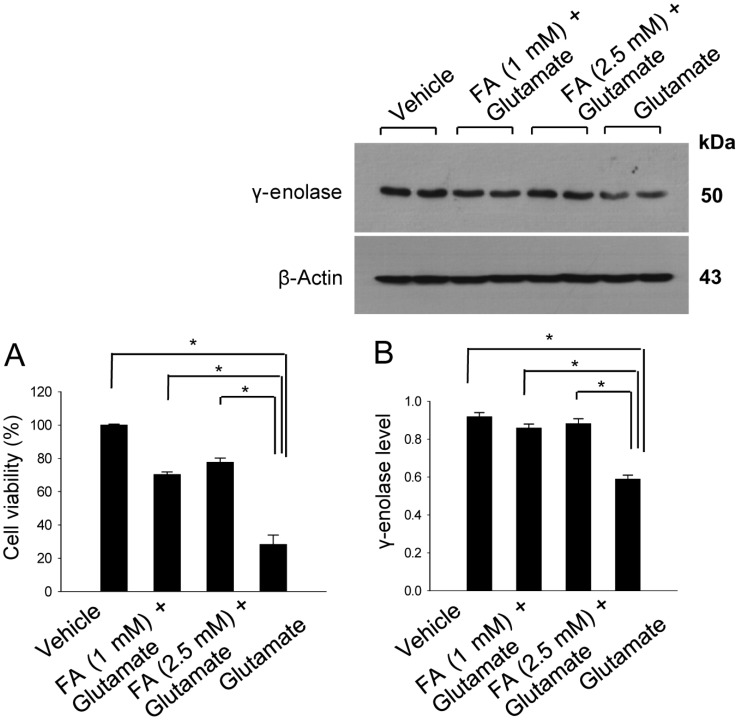
Figure 4.
Cell viability (A) and Western blot analyses of γ-enolase protein levels (B) in hippocampal neuronal HT22 cells. Glutamate (5 mM) was added to HT22 cells for 24 h, with ferulic acid (FA, 1 or 2.5 mM) added to cells 30 min before glutamate exposure. Cell viability was assessed using the MTT assay (A). Cell survival is expressed as the percentage of viable treated cells out of the percentage of viable vehicle-treated cells (set to 100%). Densitometric analysis was performed to express the intensity of each γ-enolase band relative to the intensity of the corresponding actin control band (B). Data (n=5) are represented as mean±SEM. *P<0.05.

